
Figure 5.
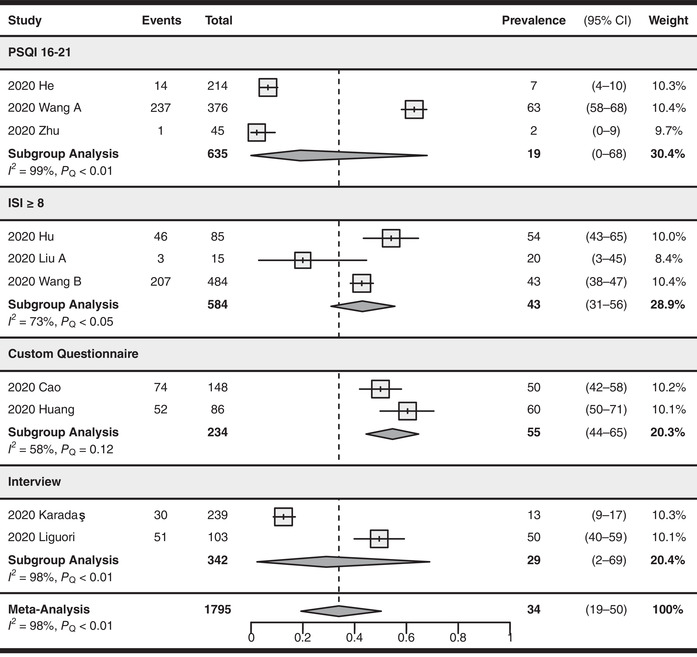
Forest plot for the pooling of sleep disturbance prevalence. Studies were separated into subgroups based on the screening tool and cutoff values used for evaluating sleep disturbances. The prevalence values are in percentages. The differences between subgroups were not statistically significant (P = 0.21). CI, confidence interval; ISI, Insomnia Severity Index; PSQI, Pittsburgh Sleep Quality Index.