
FIGURE 1.
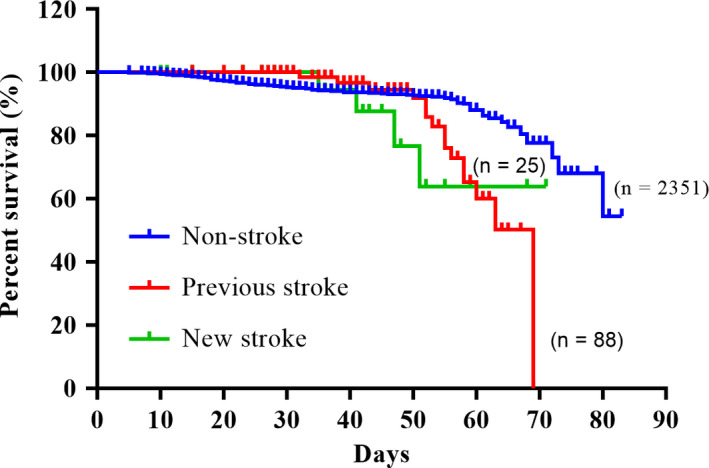
Kaplan–Meier survival curves showing previous and new stroke‐related overall survival (OS) of COVID‐19 patients. Images showing the intergroup comparison of OS between non‐stroke, new stroke and previous stroke group. Ten patients in the non‐stroke group with uncertain onset time were excluded. Non‐stroke versus Previous stroke, p = .006; Non‐stroke versus New stroke, p < .001; Previous stroke versus New stroke, p = .762