
Figure 2.
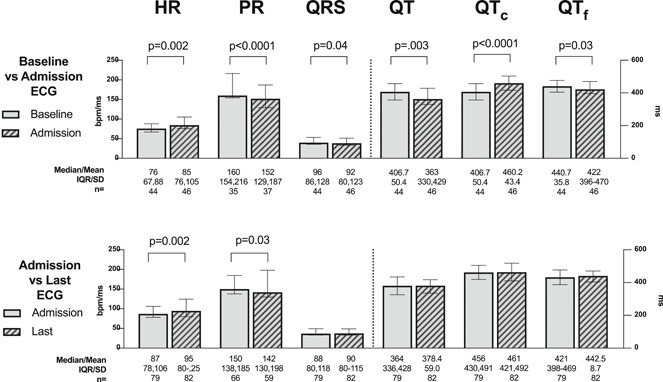
Paired electrocardiogram (ECG) comparison between admission versus baseline and versus last ECG before death. In those for whom the respective ECGs were available, the heart rate, PR interval, QRS duration, QT interval, QTc interval, and QTf interval were compared between admission and baseline (top) and between admission and the last recorded ECG before death (bottom). Statistically significant differences are annotated with p values. Other comparisons were not statistically significant. Normally distributed data as assessed by the Shapiro–Wilks test were reported as a mean with SD. Non‐normally distributed data were reported as a median with interquartile range (IQR). Paired comparisons were assessed by the paired Student's t test or the Wilcoxon signed‐rank test, as applicable. All p values are two‐tailed