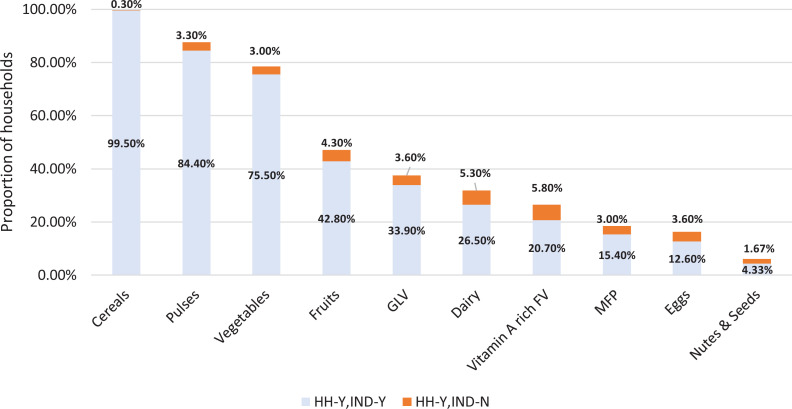
Figure 3.
Proportion of households that reported consuming each food group, by woman’s consumption status (24-hour recall), 10-point scale. Note: The total length of each bar represents the percentage of households that consumed the particular food group. It is divided into 2 categories—the blue region represents cases where the woman also reported consuming items in the food group, while the orange region represents cases where the woman did not consume that food group. Please note that the remaining percentage of households (HH) did not consume the food group.

