
Fig. 10.
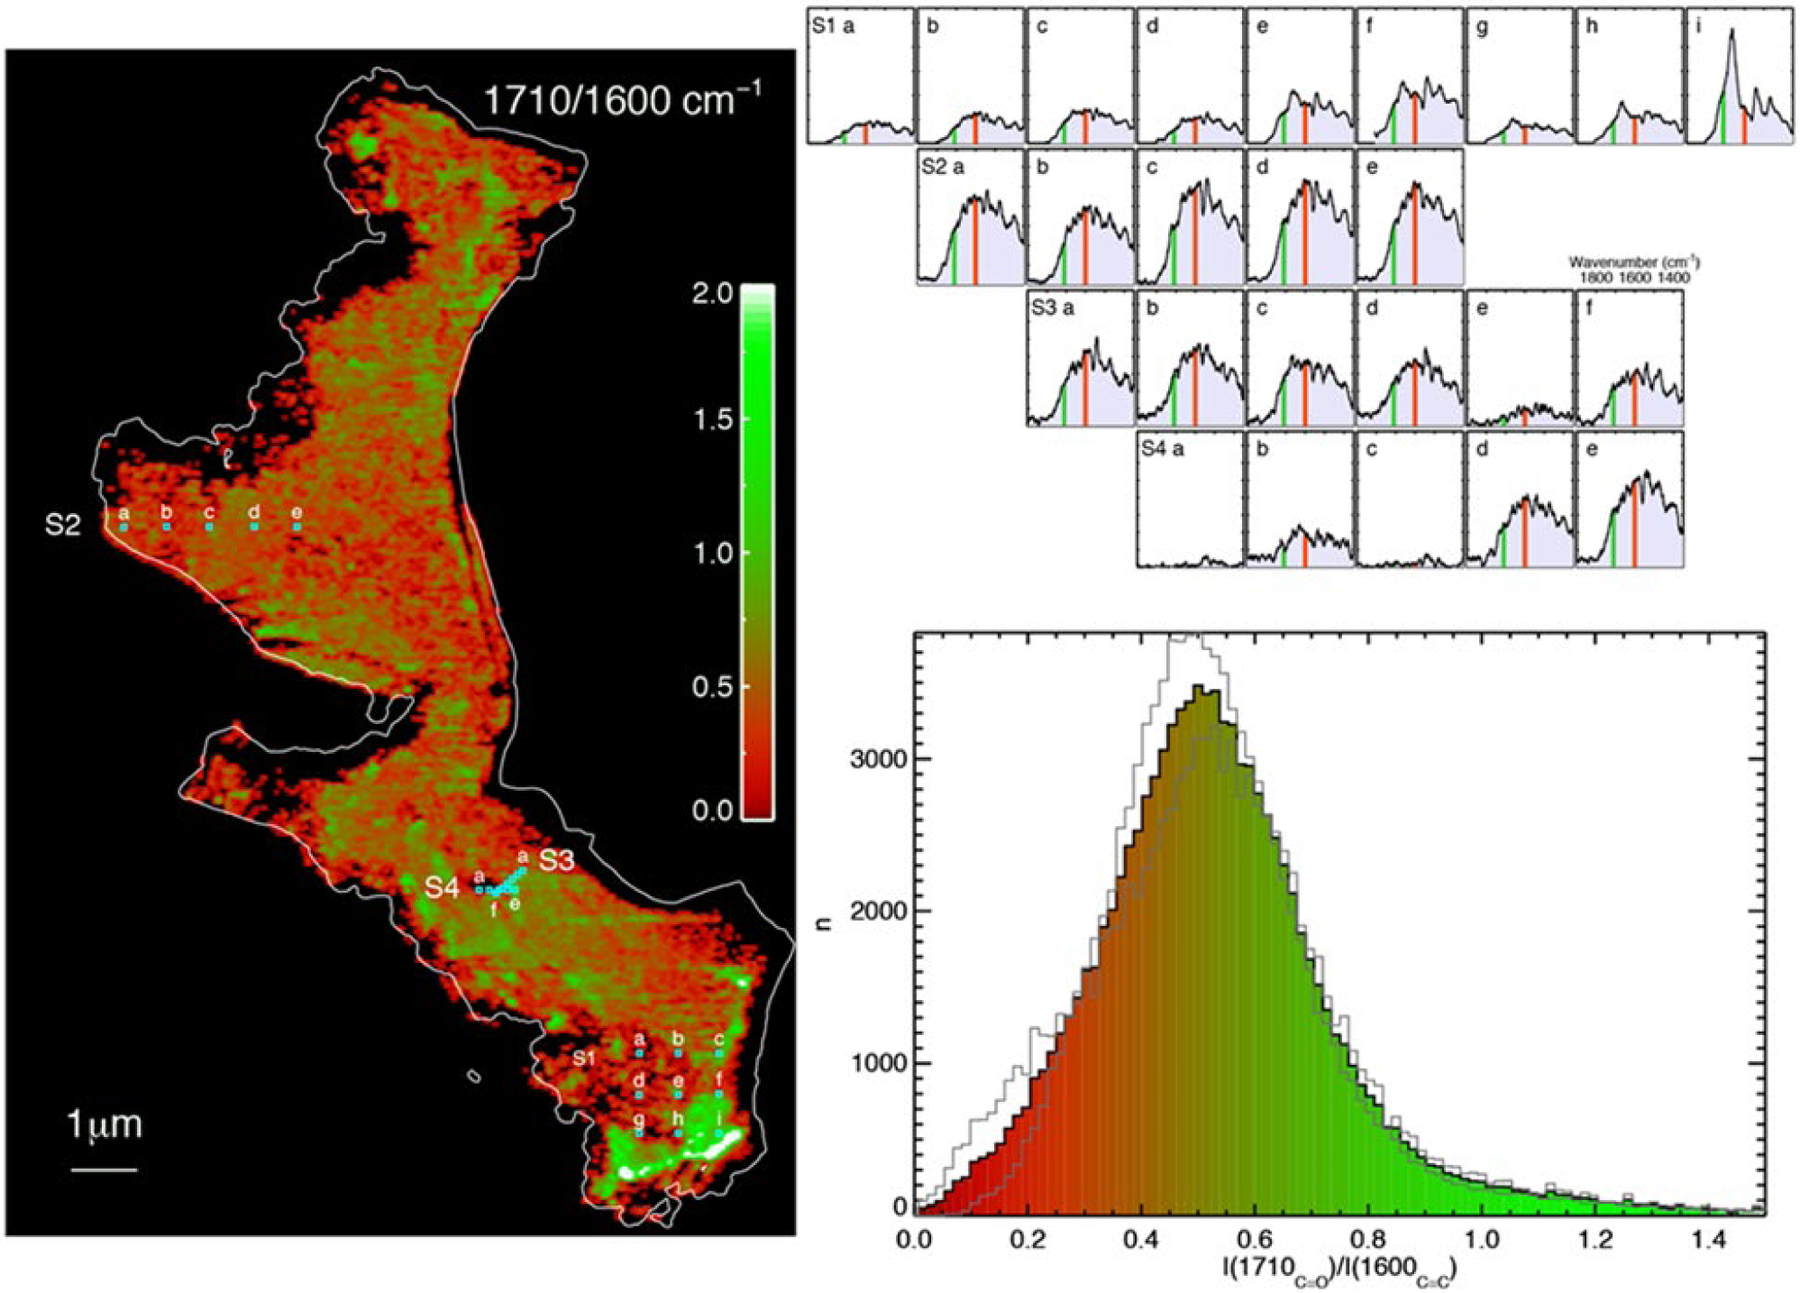
Left: AFM-IR image ratio obtained by dividing the intensity at 1710 cm−1 (C═O) with respect to the intensity at 1600 cm−1 (C═C) for the DC16–14-309-a micrometeorite. The white contour delineates the height corresponding to 5% of the maximum height measured by AFM. Top right: AFM-IR spectra (labelled S1 to S4) obtained at the selected locations marked in the left panel. The vertical lines identify the 1710 cm−1 and 1600 cm−1 wavenumber positions. Bottom right: Histogram of the AFM-IR ratio map in the left panel, highlighting the strong heterogeneity of the sample.46 These AFM-IR experiments were obtained in tapping-mode. This figure has been reproduced from D. Partouche et al. (ref. 46) with permission from ESP Sciences, copyright 2020.