
Fig. 2.
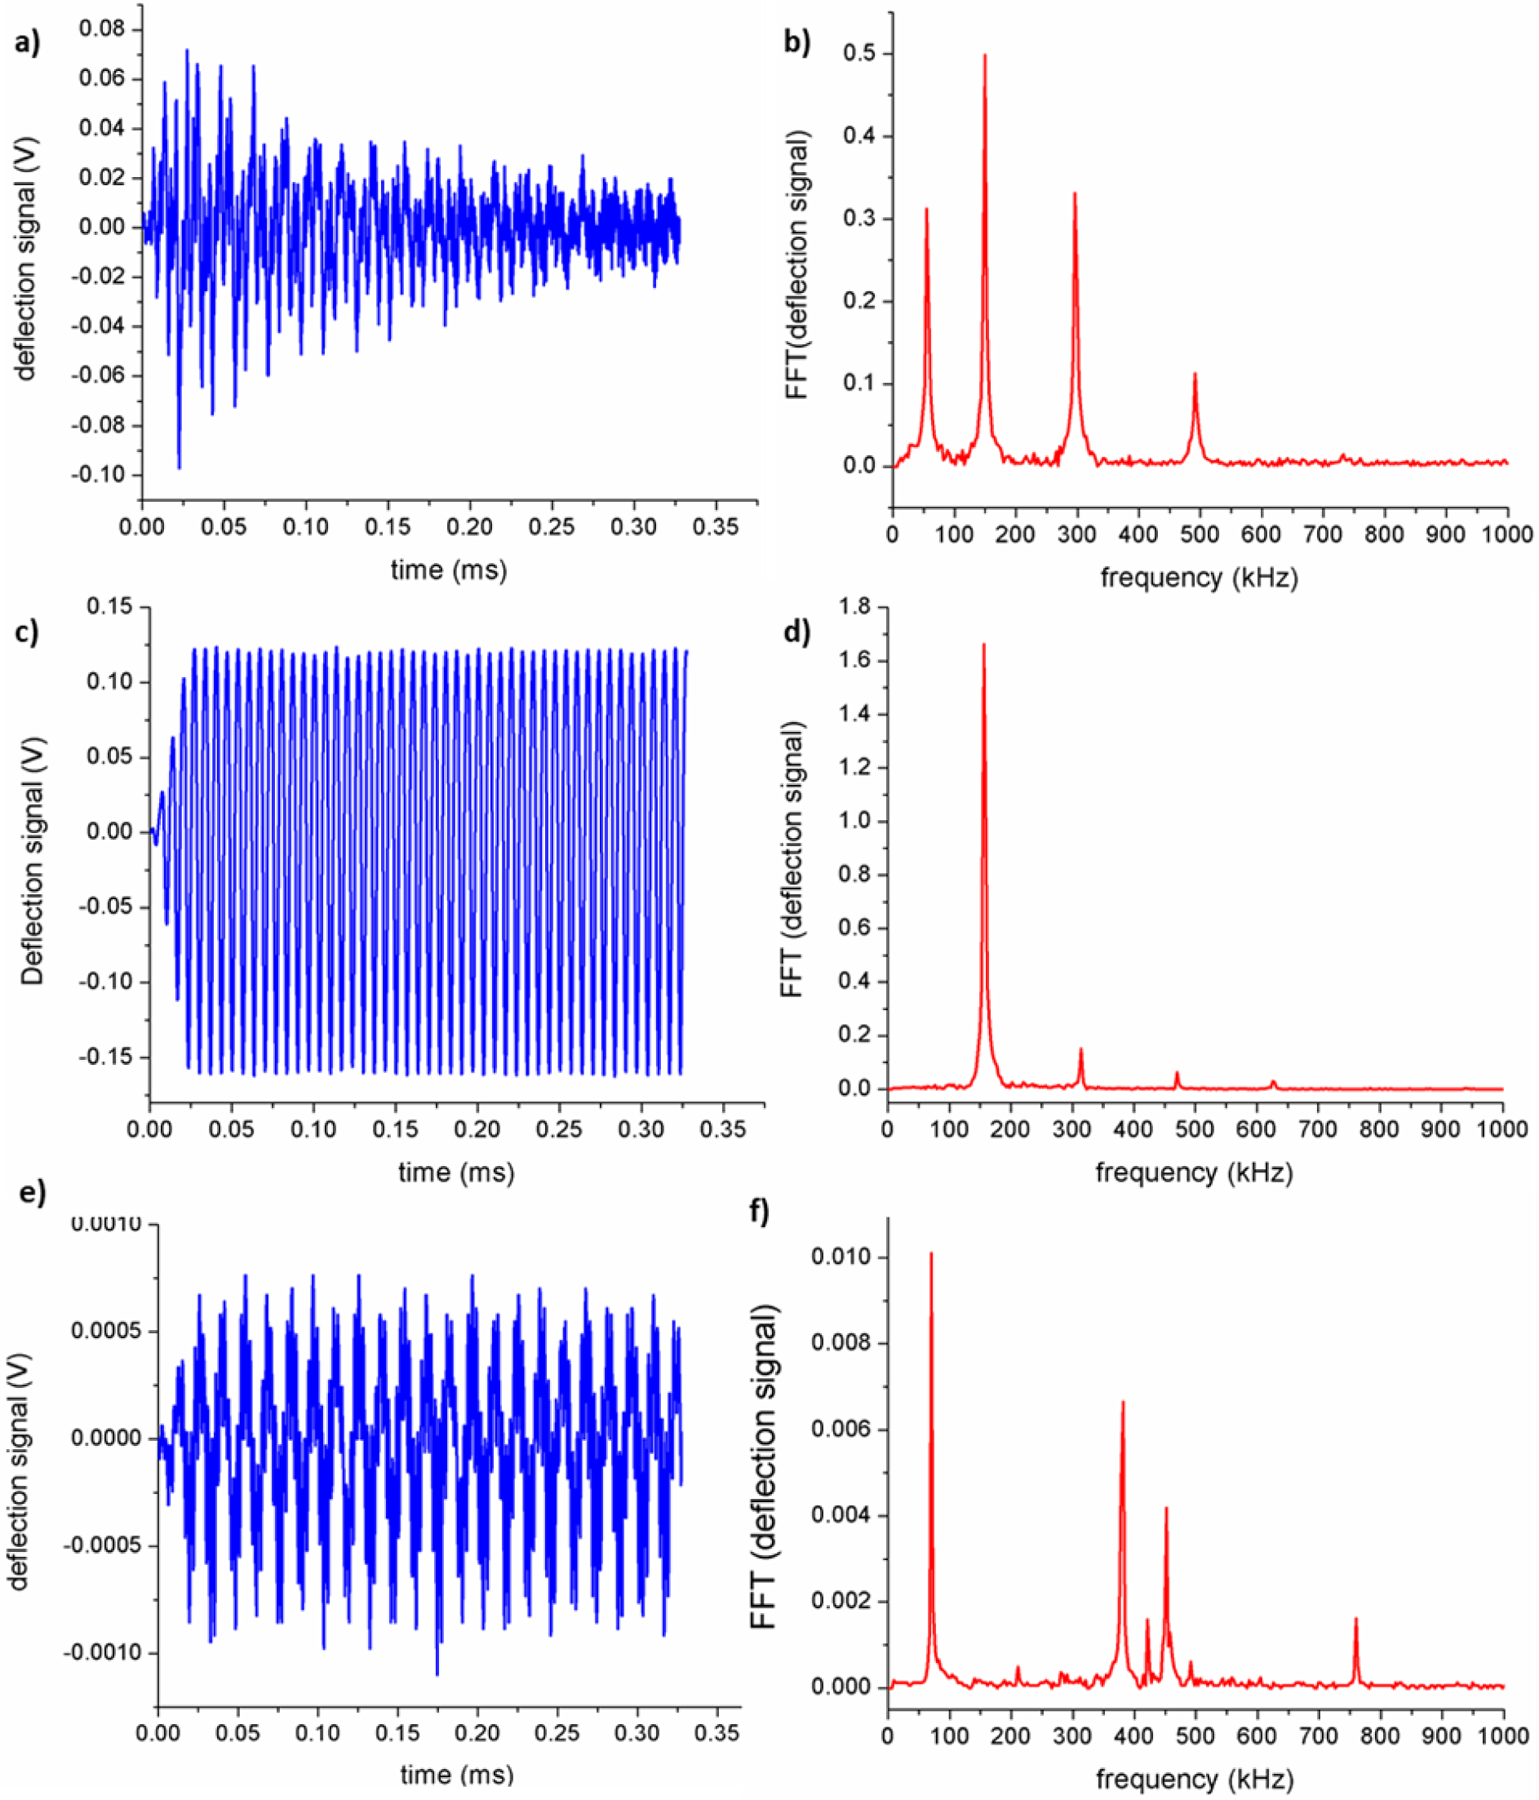
(a) Typical time domain cantilever ringdown that follows the absorption of short laser pulses in the sample. (b) FFT of the ringdown revealing the first four contact-resonance modes. (c) Typical time domain signal measured by pulsing the laser in resonance (resonance-enhanced mode) with one of the cantilever contact-resonance frequencies (≈160 kHz). (d) FFT of the resonance-enhanced signal showing that the cantilever response mainly consists of the resonantly contact-mode. (e) Typical tapping AFM-IR time-domain signal. (f) FFT of the tapping AFM-IR signal showing the driving tapping-mode frequency at 75 kHz, the laser driving frequency at 375 kHz and the second cantilever mode at 450 kHz at which the signal is demodulated.