
Fig. 5.
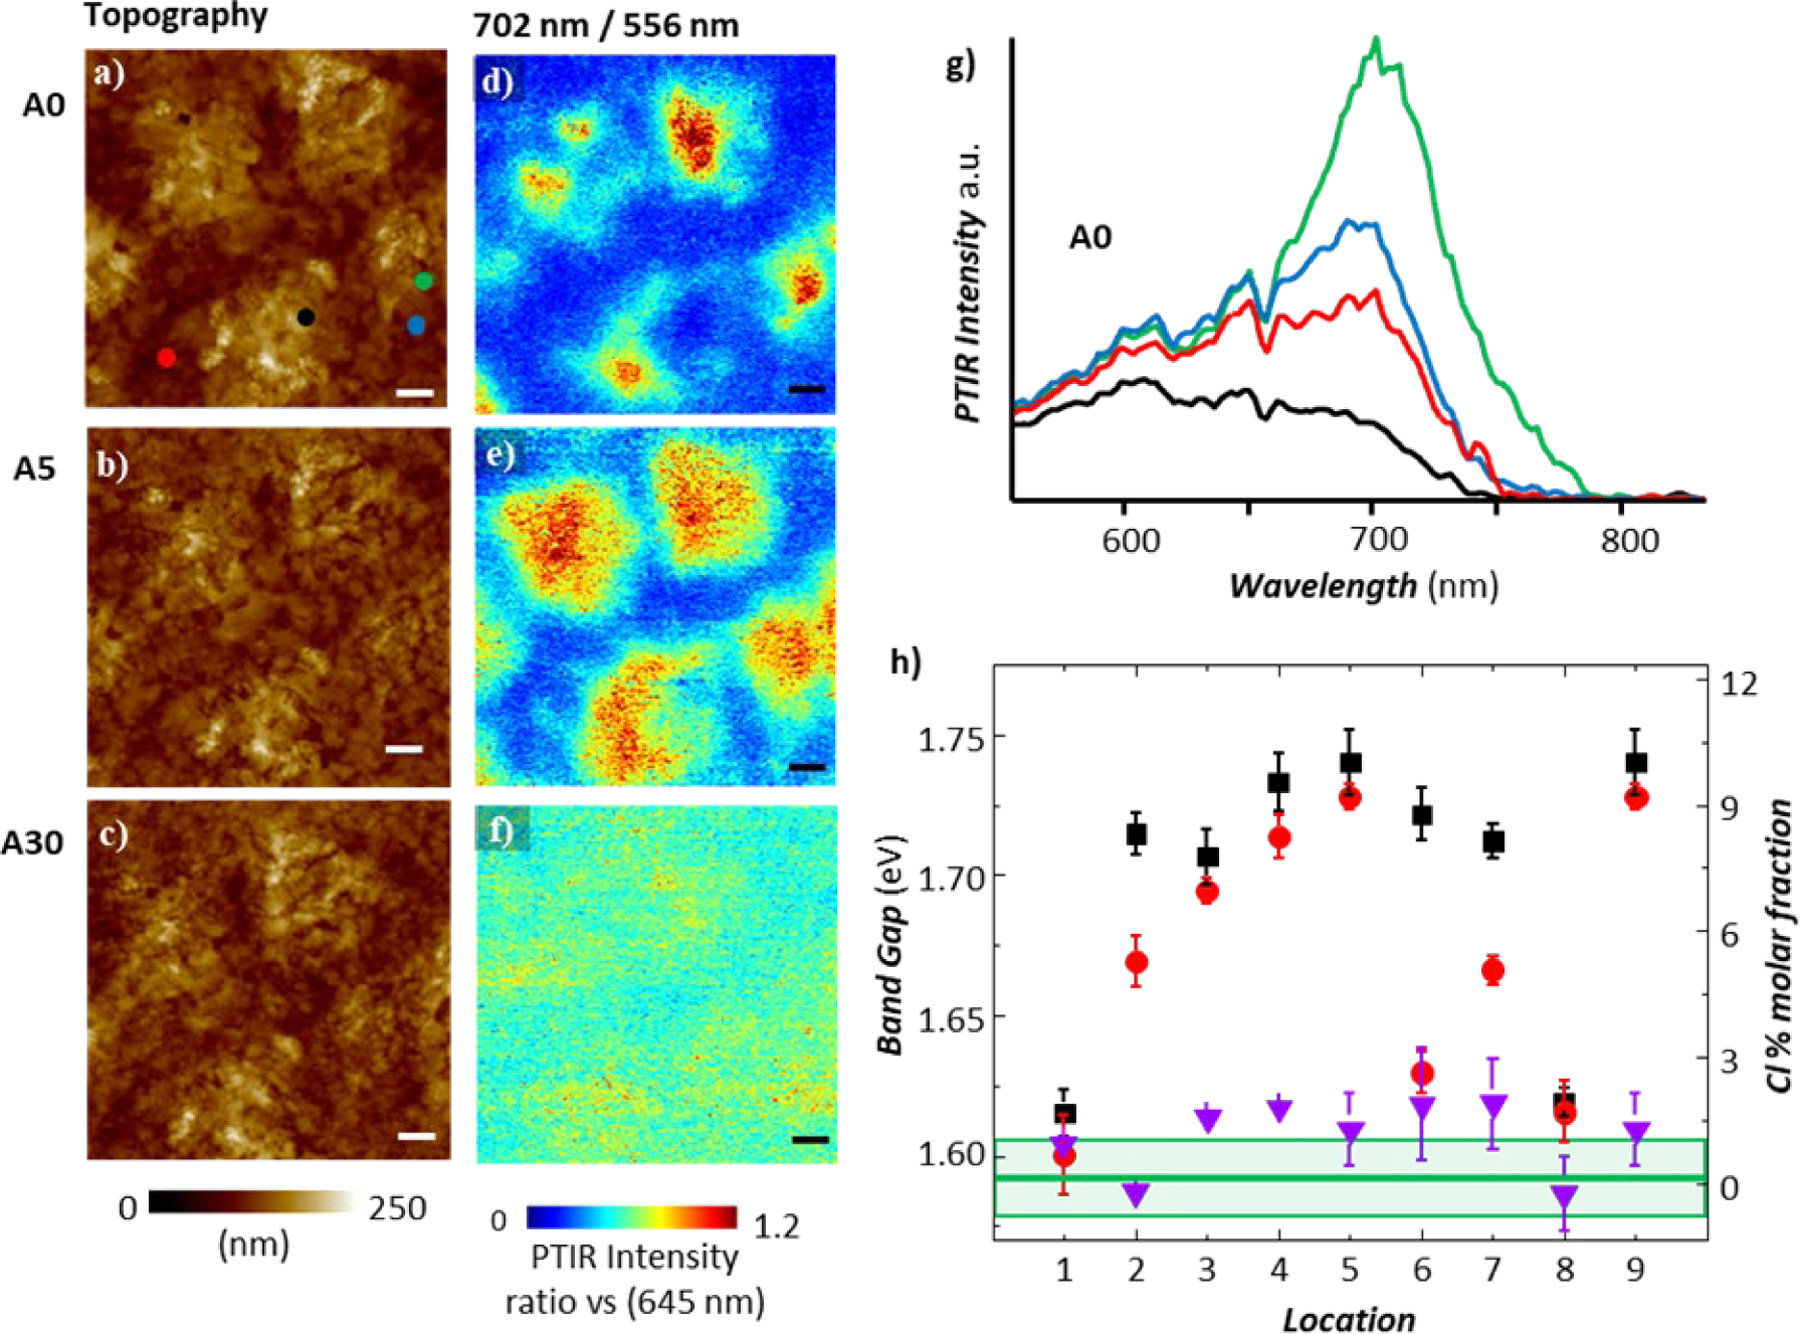
CH3NH3PbI3−xClx perovskite AFM topography maps (a–c) and corresponding absorption ratio (702 nm/556 nm, i.e. 1.77 eV/2.23 eV) maps (d–f) as a function of annealing: A0, as prepared (a and d), A5, 5 min annealing at 95 °C (b and e), A30, additional annealing for 5 min at 95 °C and for 20 min and at 110 °C (c and f). The red and blue tones indicate Cl-poor and Cl-rich regions, respectively. All scale bars are 1.0 μm. (g) PTIR spectra obtained at the color-coded locations in panel-a for the as prepared sample. (h) Local bandgap (left axis) and local Cl% content (right axis) obtained by linearly fitting the spectra at 9 locations as a function of annealing: as prepared sample (A0, black squares), A5 (red circles), A30 (purple triangles). Upon annealing the local bandgap and Cl− content decreases at all locations, approaching the bandgap of the CH3NH3PbI3 phase (green horizontal line). The light green rectangle and error bars represent a single standard deviation in the calculation of the local bandgap due to the linear fitting of nanoscale the absorption spectra.41 These AFM-IR experiments were obtained in ringdown mode. Adapted with permission from J. Chae et al., Nano Lett., 2015, 15, 8114–8121. Copyright (2015) American Chemical Society.