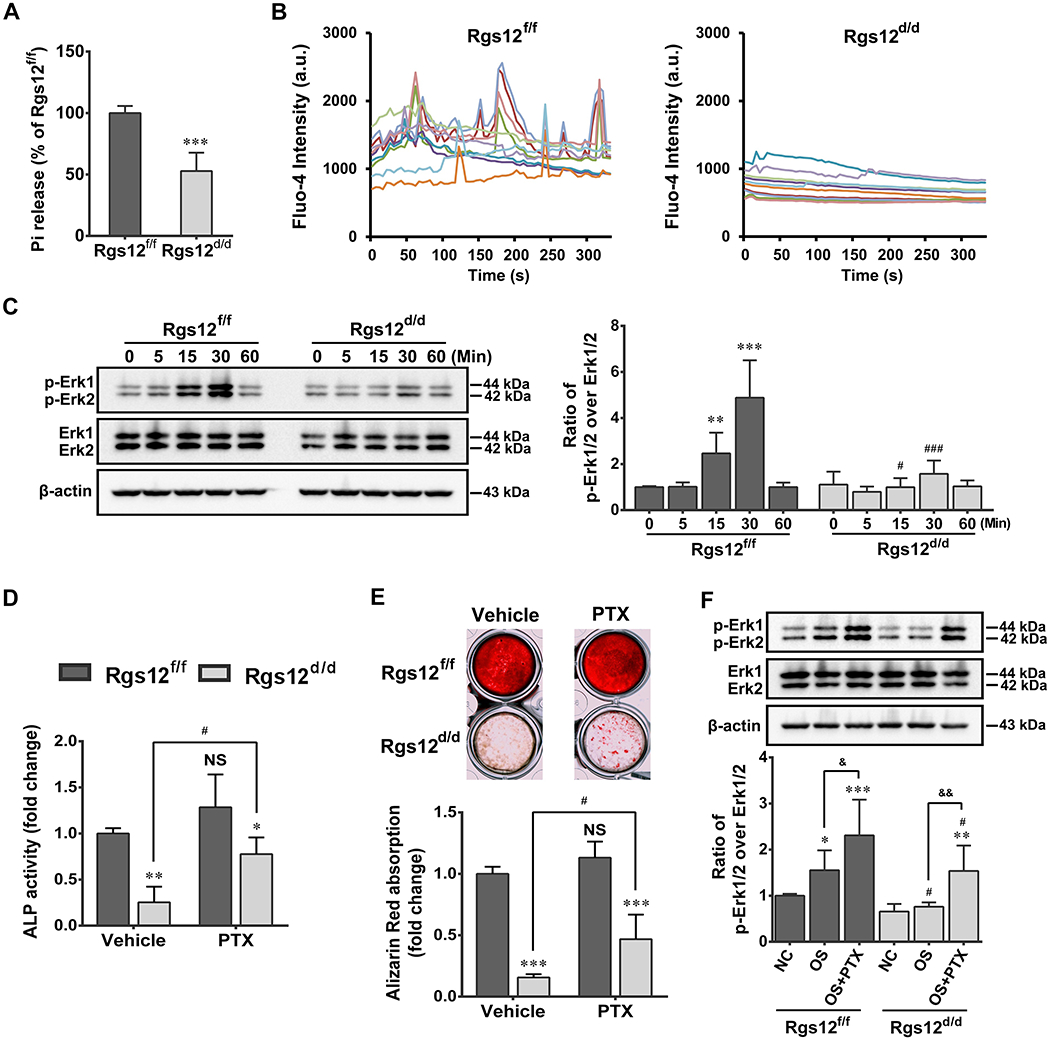
Fig. 4. Deletion of Rgs12 inhibits GTPase activity, Ca2+ oscillations and sequentially blocks ERK activation; and PTX treatment partially rescued defective OB differentiation and function.

(A) GTPase assay showed inorganic phosphate (Pi) release level in OPCs. ***p <0.001 vs Rgs12f/f cells; n=4. (B) Analysis of Ca2+ oscillations in OPCs after 3 days of OS medium stimulation. Cells were traced, calculated, and plotted over time using different colors (n=10 cells of each group). (C) WB showed phosphorylated ERK (p-ERK) expression in OPCs. Cells were starved for 6h prior to OS medium stimulation, p-ERK were normalized to total ERK. **p <0.01, ***p <0.001 vs 0 min; #p <0.05, ###p < 0.001 vs same time point in Rgs12f/f cells; n=4. (D) ALP activity of OPCs with or without PTX treatment at day 7 of osteogenic induction. (E) Alizarin Red absorption and staining of OPCs with or without PTX treatment at day 28 of osteogenic induction. *p <0.05, **p <0.01, ***p <0.001 vs Rgs12f/f cells within groups; NS, not statistical significant or #p <0.05 vs same cells without PTX treatment; n=4. (F) WB analysis of p-ERK in OPCs with or without PTX treatment. Cells in PTX group were pretreated with PTX (100ng/ml) overnight in complete culture medium, followed by 6h starvation and then OS medium stimulation combine PTX for 15 min. NC and OS group were only stimulated with OS medium for 0 or 15 min. *p <0.05, **p <0.01, ***p <0.001 vs NC within groups; #p <0.05 vs same subgroup in Rgs12f/f; &p <0.05, &&p <0.01 vs OS within groups; n=4. Quantitative data were presented as mean ± SD.
