
Fig. 6. Deletion of Rgs12 attenuates the BayK8644-amplified Ca2+ influx through L-type Ca2+ channel.
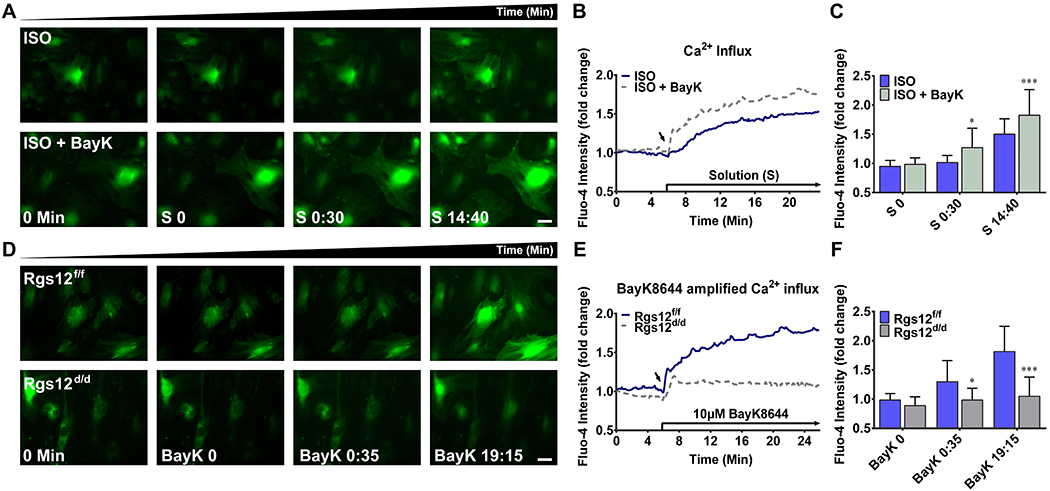
(A), (B) and (C): Effect of BayK8644 on intracellular Ca2+ in Rgs12f/f OPCs. (A) Representative images of intracellular Ca2+ in Rgs12f/f OPCs in the presence or absence of 10μM BayK8644 stimulation. OPCs were incubated in Ca2+ free ISO as previous described, and treated with BayK8644 in ISO (lower panel) or ISO alone (upper panel). (B) Overlay of traces from OPCs. Arrow indicated the time point when different solutions applied (S, started from S 0 min). Data was expressed as a fold change as previous described (n=28 cells per group). (C) Quantitative analysis of fluo-4 intensity at indicated time point. *p <0.05, ***p <0.001 vs cells without BayK8644, n=28 cells per group. (D), (E) and (F): Effect of BayK8644 on Rgs12f/f or Rgs12d/d OPCs. (D) Representative images of intracellular Ca2+ for OPCs before (0 min) and after stimulation of 10μM BayK8644 (BayK, started from BayK 0 min). OPCs were incubated in Ca2+ free ISO as previous, and treated with BayK8644 in ISO. Upper panel, Rgs12f/f OPCs; lower panel, Rgs12d/d OPCs. (E) Overlay of traces from OPCs. Arrow indicated the time point of BayK8644 application. Data was expressed as a fold change (n=28 cells per group). (F) Quantitative analysis of fluo-4 intensity at indicated time point. *p <0.05, ***p <0.001 vs Rgs12f/f cells, n=28 cells per group. Scale bars, 50μm. Quantitative data were presented as mean ± SD.