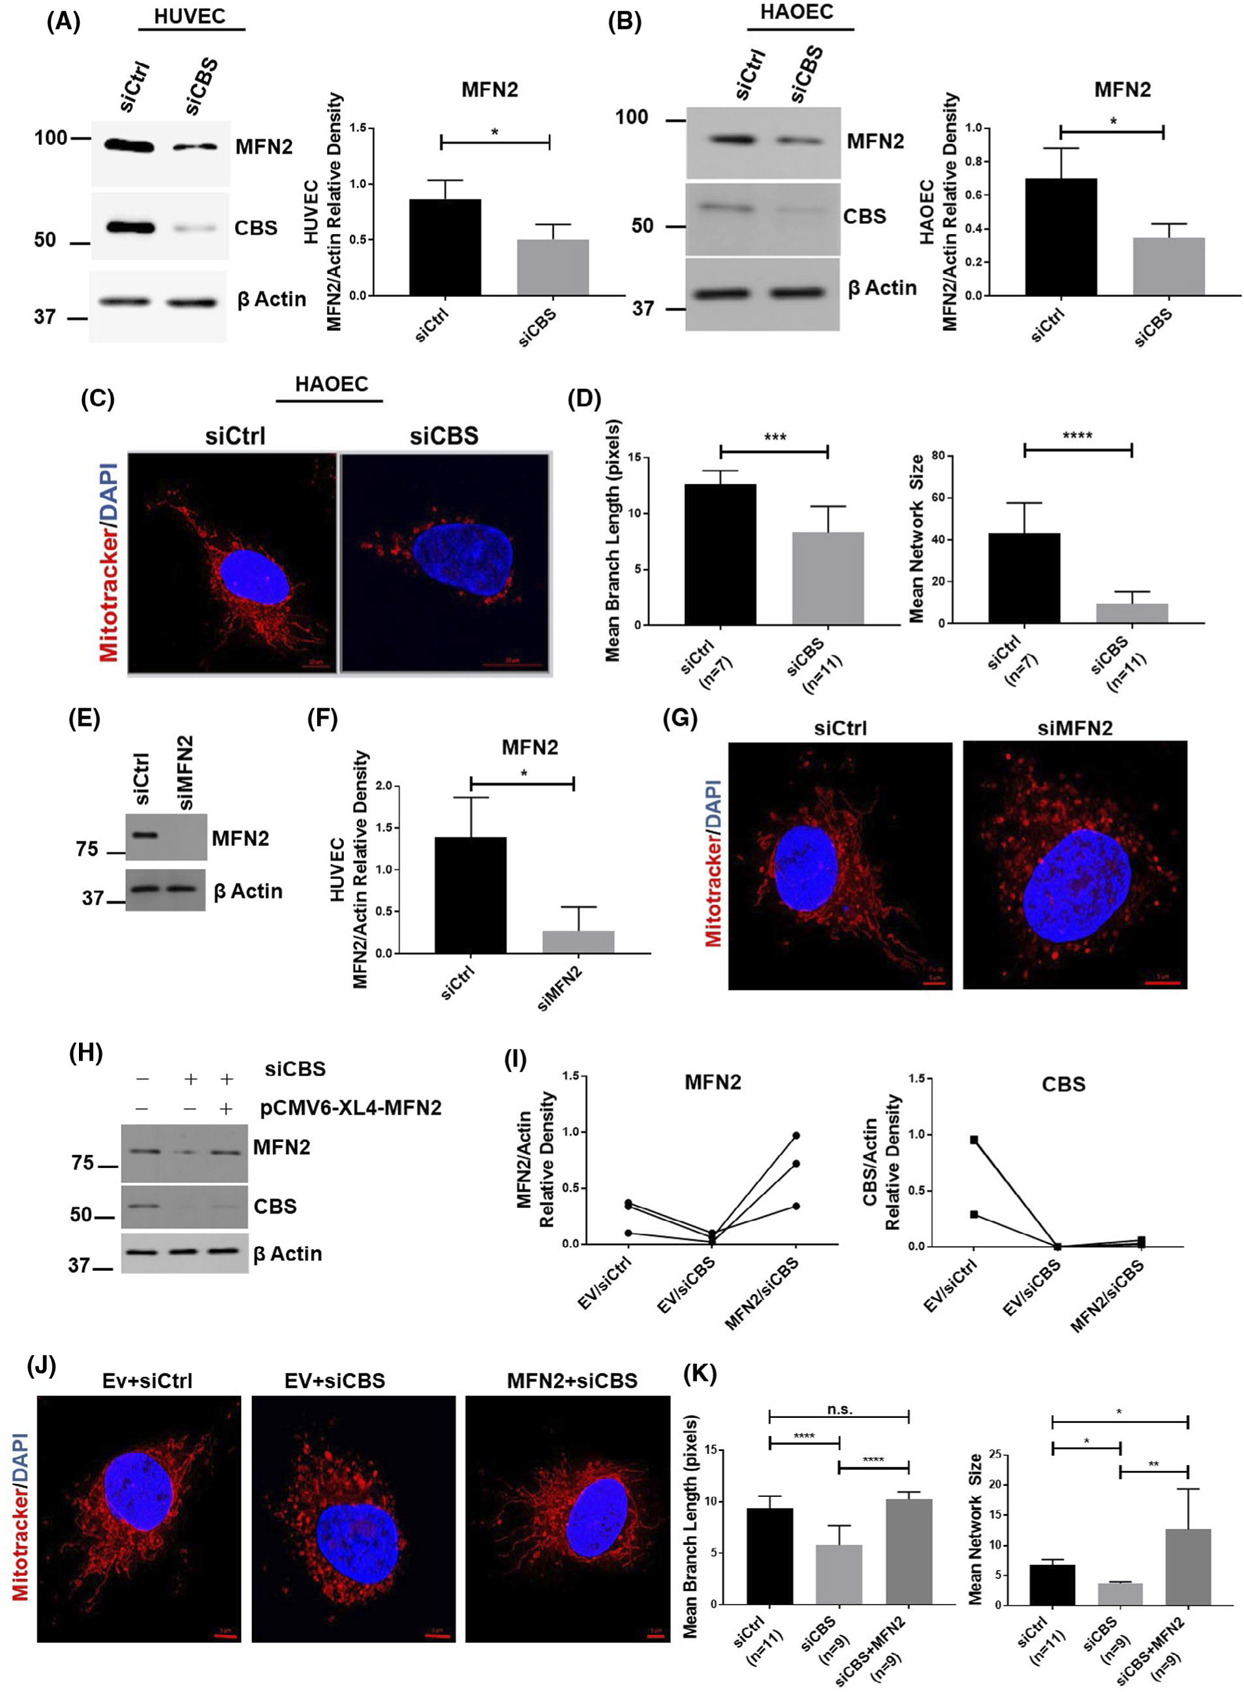
FIGURE 3.

CBS silencing downregulates MFN2 expression. Expression of mitofusin 2 (MFN2) as determined by immunoblotting and densiometric analysis in HUVECs (n = 3) A, and HAOEC cells (n = 3) B,, either transfected with scrambled siRNA (siCtrl) or siRNA against the CBS gene. Efficient gene silencing was determined by immunoblotting with CBS antibody and actin served as a loading control. C, Mitochondrial morphology was depicted by immunofluorescence of siCtrl and siCBS in HAOEC cells, stained with Mitotracker Red CMXRos and counterstained with DAPI (nucleus; blue). Original scale bars, 5 μm. D, Mitochondria network size is defined as the average number of branches per network. Mean branch length is the average length (in pixels) of all the branches in one network. A Student’s t test (α = 0.05) was used to compare CBS knockdown siCBS (n = 11 cells) with control siCtrl (n = 7 cells) in HUVECs. Representative immunoblot E, and densiometric analysis (n = 3) F, of HUVECs transfected for 48 hours with scrambled siRNA (siCtrl) or siRNA against MFN2 (siMFN2) with Actin as the loading control. G, Mitochondrial morphology was depicted by immunofluorescence of siCtrl and siMFN2 cells stained with Mitotracker Red CMXRos and counterstained with DAPI (nucleus; blue). Original scale bars, 5 μm. H, Expression levels and I, densiometric analysis of MFN2 as determined by immunoblot. Efficient gene silencing was determined by immunoblotting with CBS antibody and actin served as a loading control. J, Mitochondrial morphology was depicted by immunofluorescence of Ev/siCtrl (n = 11 cells), Ev/siCBS (n = 9 cells) and siCBS/MFN2 (n = 9 cells) stained with Mitotracker Red CMXRos and counterstained with DAPI (nucleus; blue). Original scale bars, 5 μm. K, Mitochondria morphology analysis of J. All immunoblot experiments were performed three times in triplicate and values are represented as means ± SEM. P ≤ .05 is considered statistically significant. Confocal imaging experiments were repeated and data from one set is shown here as means± SEM. P ≤ .05 is considered statistically significant
