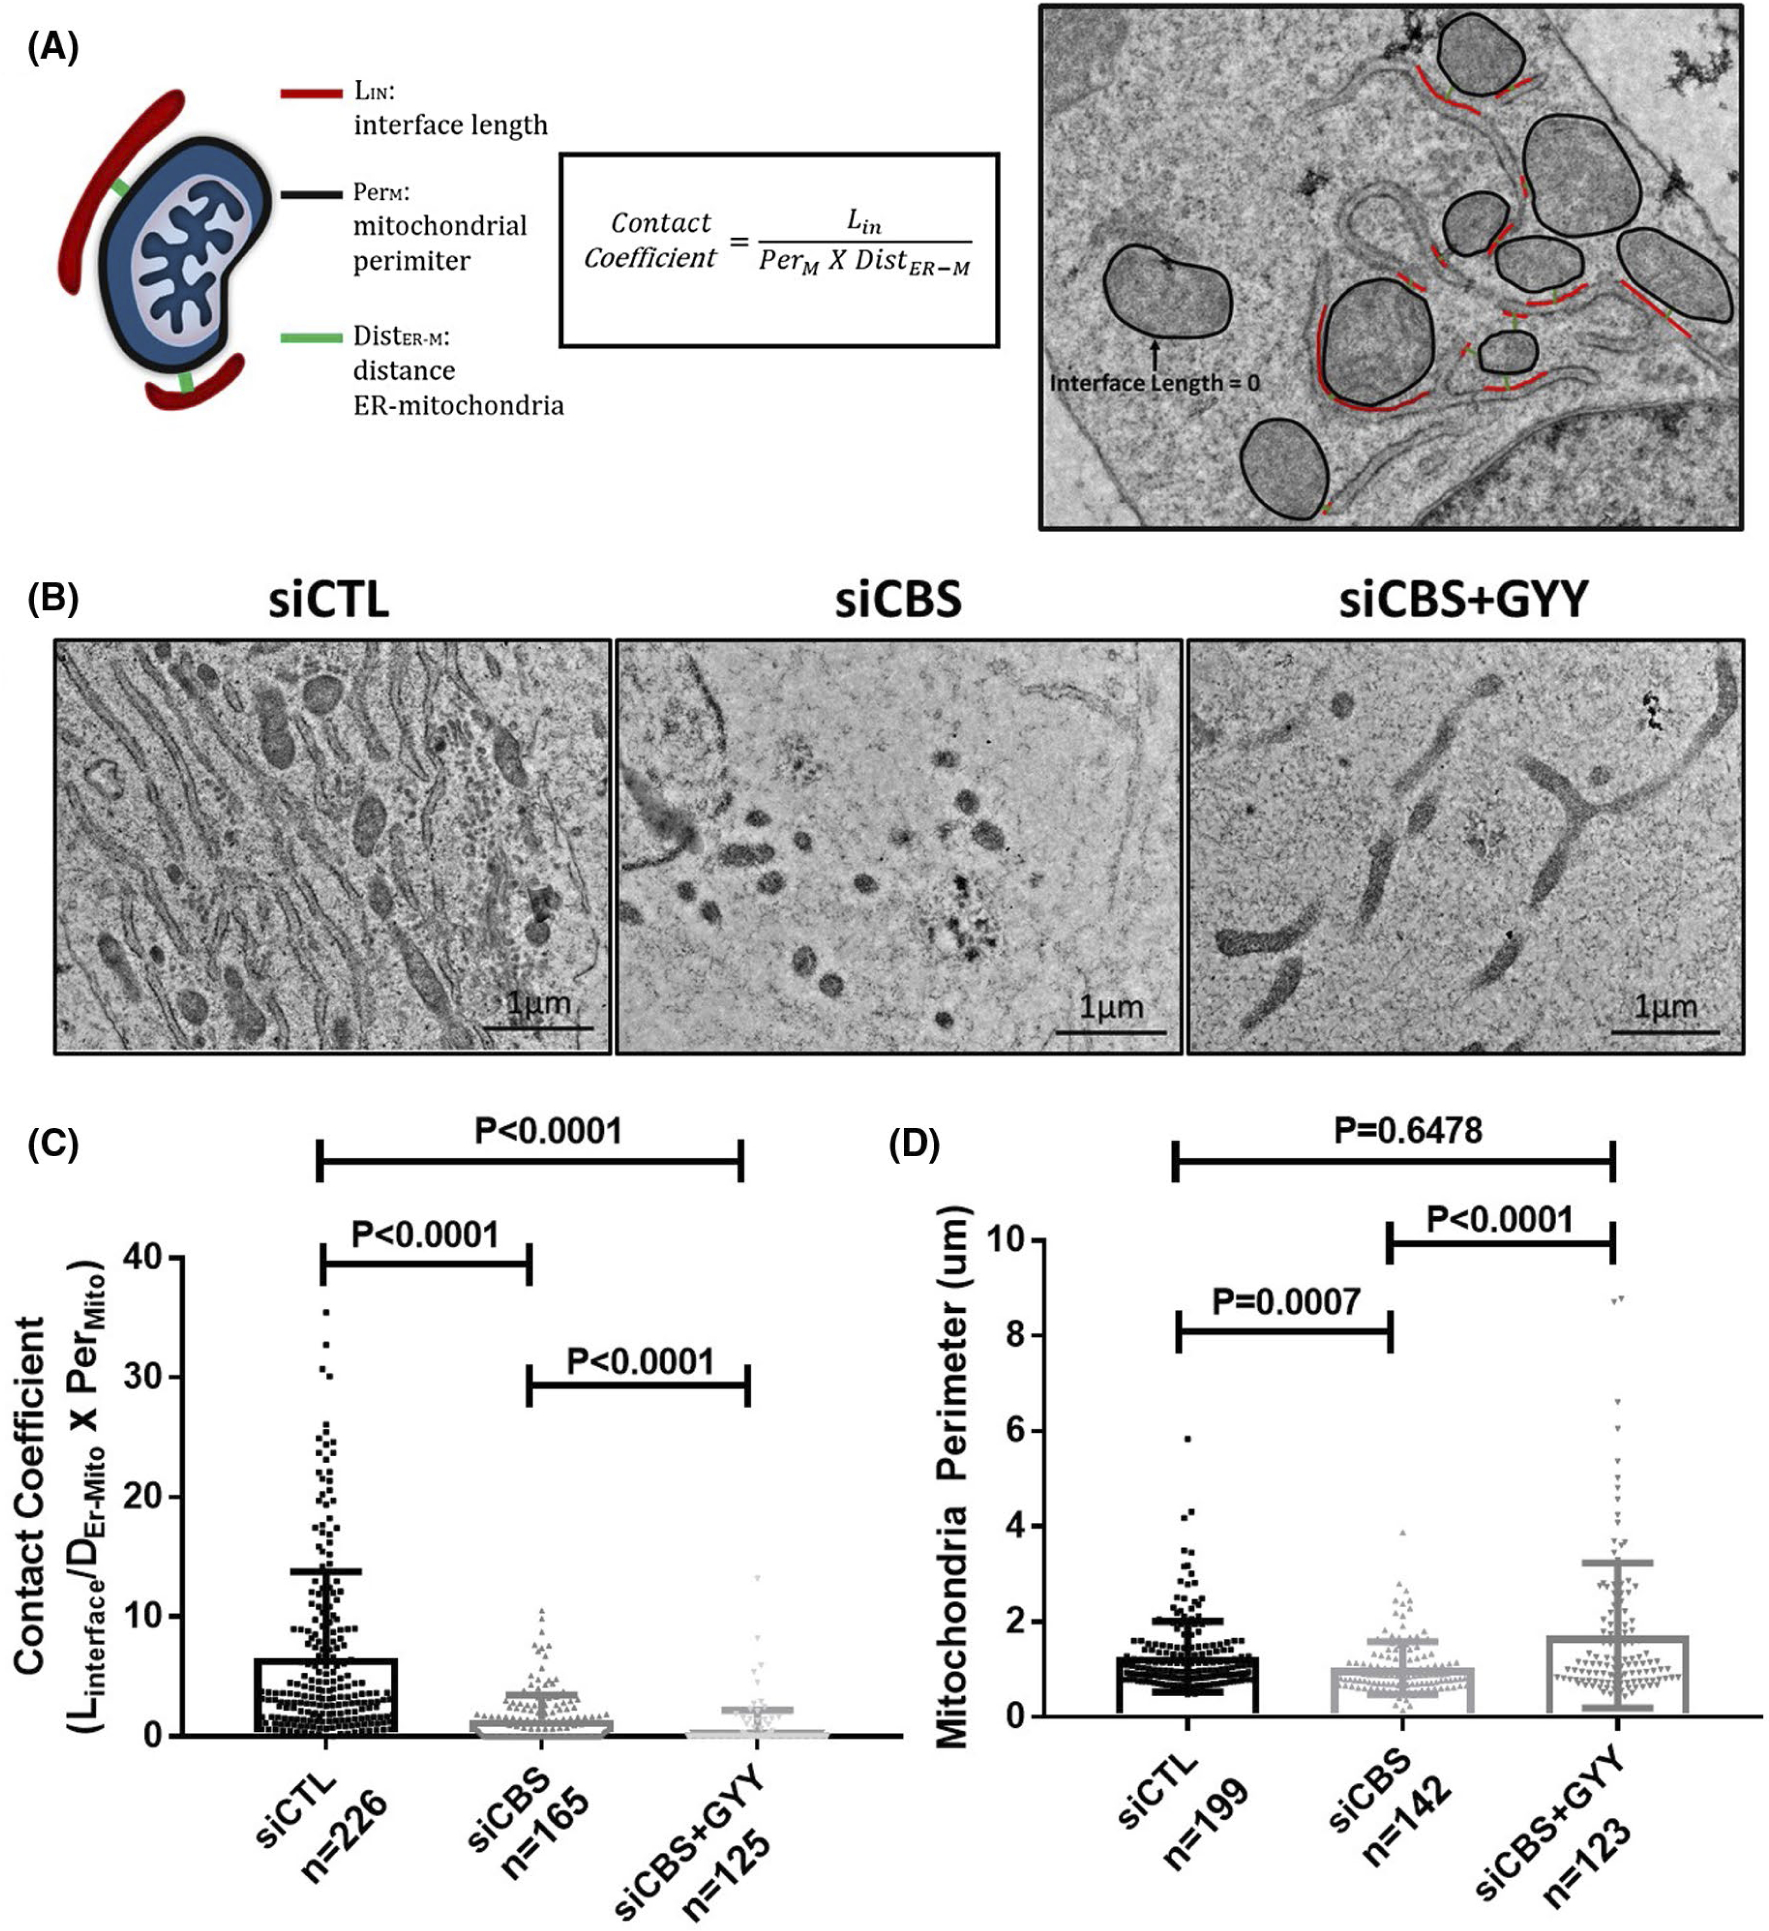
FIGURE 7.

CBS silencing disrupts mitochondria-ER contacts. A, Schematic of ER-mitochondria contact coefficient analysis method and example image of ER-mitochondria contact coefficient analysis. Representative images B, and analysis of ER-mitochondria contact coefficients C, and mitochondria perimeter D, in HUVECs transfected for 48 hours with scrambled siRNA (siCtrl) or siRNA against the CBS gene (siCBS) and treated with the H2S donor GYY4137 (GYY) (1 mM/24 hours). N is defined as each dot and represents one ER-mitochondria contact. Original scale bars, 1 μm. Data are presented as means ± SD P ≤ .05 is considered statistically significant
