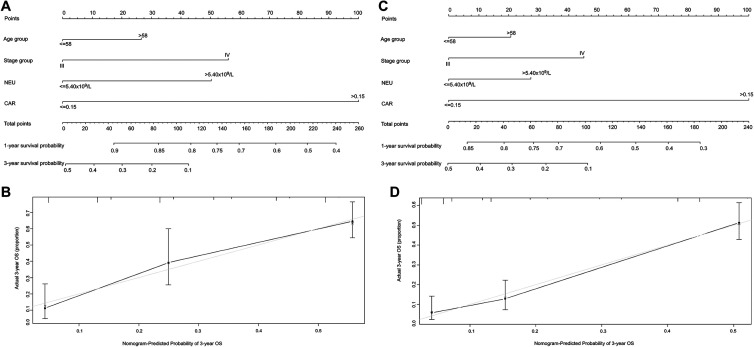
Figure 1.
Nomogram showing results of the prognostic model using age, clinical stage, CAR, and NEU characteristics predicting OS in the primary cohort (A). Nomogram model predicting the 1- and 3-year OS of patients with NSCLC in the validation cohort (C). Calibration curves predicting patient OS at 3 years in the primary cohort (B) and validation cohort (D). Total points projected on the bottom scales indicate the probability of 1- and 3-year survival.

