Fig. 1.
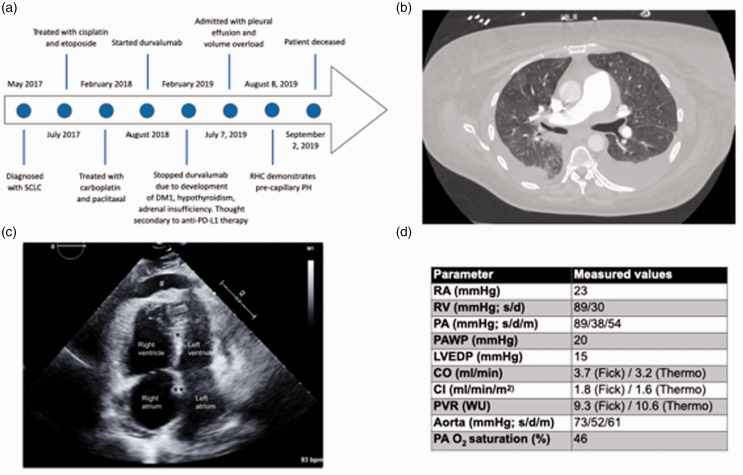
Timeline, imaging studies and hemodynamic values. (a) A timeline of the patient’s clinical course. SCLC: small cell lung cancer, DM1: type 1 diabetes mellitus, RHC: right heart catheterization, PH: pulmonary hypertension. (b) A computer tomography image depicting mild diffuse ground-glass opacities as well as pulmonary artery enlargement and bilateral pleural effusions. (c) A two-dimensional-echocardiographic apical four chamber view. Note right atrial and right ventricular enlargement, leftward shift of interventricular septum (*) and interatrial septum (**), compression of left atrium and left ventricle, as well as presence of a pericardial effusion (#). (d) Hemodynamic values during right heart catheterization. RA: right atrium; RV: right ventricle; PA: pulmonary artery; PAWP: PA wedge pressure; LVEDP: left ventricular end-diastolic pressure; CO: cardiac output; CI: cardiac index; PVR: pulmonary vascular resistance; WU: Wood units; s: systole; d: diastole; m: mean. Dobutamine was stopped during RHC measurements.

