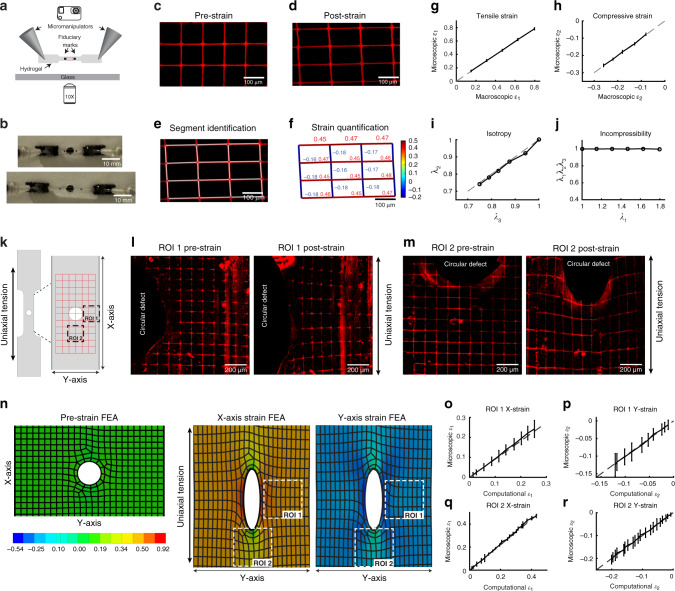
Fig. 2. Uniaxial tensile testing and finite element analysis of the nanomechanical biosensor (NMBS) on a polydimethylsiloxane (PDMS) test strip.
a A PDMS dog bone test strip with applied NMBS is mounted on micromanipulators attached to a wide-field fluorescence microscope to view the NMBS (100 µm × 100 µm × 10 µm) from underneath while tracking fiducial marks on the top surface during uniaxial tensile testing. b Example images of the PDMS test strip in the pre-strain and post-strain states. c Representative fluorescence image of pre-strained NMBS prior to tensile testing. d Representative fluorescence image of deformed NMBS following tensile testing. e Image segmentation and analysis is performed to identify rectangular mesh NMBS nodes and segments are then overlaid onto the deformed image. f Segment lengths are converted into tensile (positive) and compressive (negative) mechanical strains with respect to their pre-strain reference length. A color map reveals locations of tensile (red) and compressive (blue) mechanical strains. g The microscopic tensile strain ε1 of the NMBS strongly correlates with the macroscopic tensile strain ε1 of PDMS (mean ± S.D.; n = 12 segments over 1 experiment). h The microscopic compressive strain ε2 of the NMBS strongly correlates with the macroscopic compressive strain ε2 of PDMS (mean ± S.D.; n = 12 segments over 1 experiment). i There is a strong correlation between the stretch ratios λ2 and λ3 confirming that PDMS is an isotropic material. j The product of the stretch ratios λ1λ2λ3 is equal to 1 confirming that PDMS is incompressible. k A circular defect in the PDMS test strip was introduced to track heterogeneous strain fields with the NMBS during uniaxial tensile testing. l Representative fluorescence images from ROI 1 (region adjacent to the circular defect and antiparallel to the uniaxial tension) of the NMBS pre and post tensioning. m Representative fluorescence images from ROI 2 (region adjacent to the circular defect and parallel to the uniaxial tension) of the NMBS pre and post tensioning. n Finite element analysis of a PDMS test strip with a circular defect in the pre-strain, X-strain, and Y-strain states following 40% uniaxial strain (blue = compression; green = no strain; red = tension). o Quantitative analysis of ROI 1 reveals a strong correlation between the microscopic X-strain ε1 of the NMBS with the computational tensile X-strain ε1 (mean ± S.D.; n = 28 segments over 1 experiment). p Additionally, there is a strong correlation between the microscopic Y-strain ε2 of the NMBS with the computational compressive Y-strain ε2 (mean ± S.D.; n = 30 segments over 1 experiment). q Quantitative analysis of ROI 2 reveals a strong correlation between the microscopic X-strain ε1 of the NMBS with the computational tensile X-strain ε1 (mean ± S.D.; n = 8 segments over 1 experiment). r Additionally, there is a strong correlation between the microscopic Y-strain ε2 of the NMBS with the computational compressive Y-strain ε2 (mean ± S.D.; n = 9 segments over 1 experiment).

