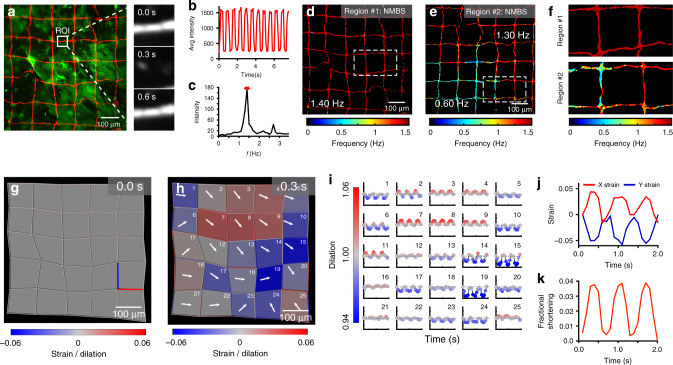
Fig. 4. Beat frequency analysis and strain mapping during cardiomyocyte contractions.
a Fluorescence image of representative Alexa-555 fibronectin NMBS (Red, 100 µm × 100 µm × 10 µm) applied to iPSC-derived cardiomyocyte monolayer loaded with Fluo-4 calcium indicator dye (Green). White box indicates ROI for NMBS motion analysis. Motion analysis of ROI displays NMBS segment moving in and out of the ROI over time. b Quantification of the average fluorescence intensity from the ROI through time. c Example power spectral density plot from the Fourier transformed data of a NMBS ROI segment showing the intensity at each frequency with a dominant frequency of 1.4 Hz. d A synthetic image is constructed containing the frequency information of every pixel within the NMBS to visualize variability of contractile frequencies for cardiomyocyte monolayers. A dominant uniform frequency of 1.4 Hz is observed. e Example region #2 of contractile cardiomyocytes demonstrating heterogeneous beat frequencies of 1.3 and 0.6 Hz. f Magnified images of region #1 and #2 demonstrating differences in heterogeneity between fields. g, h Time-series showing regional dilation and NMBS segment strain throughout a contraction cycle of diastole and systole. Displacement vectors (white arrows) for each square region defined by the NMBS show the contractile direction between peak systole and diastole. i Analysis of dilation over a 2 s time interval defined by the NMBS meshed regions (red = tension, blue = compression). j Quantitative analysis of example X (red line in g) and Y (blue line in g) strain from NMBS segments shows the tensile and compressive strain rate over time for cardiomyocytes with a beat frequency of 1.4 Hz, maximum tension of 4% and compression of 6%. k Fractional shortening is calculated from a regional dilation analysis of ROIs 13, 14, 18, and 19 demonstrating a peak fractional shortening of 3.8% ± 0.06 between diastole and systole (mean ± S.D.; n = 3 cycles over 1 experiment).

