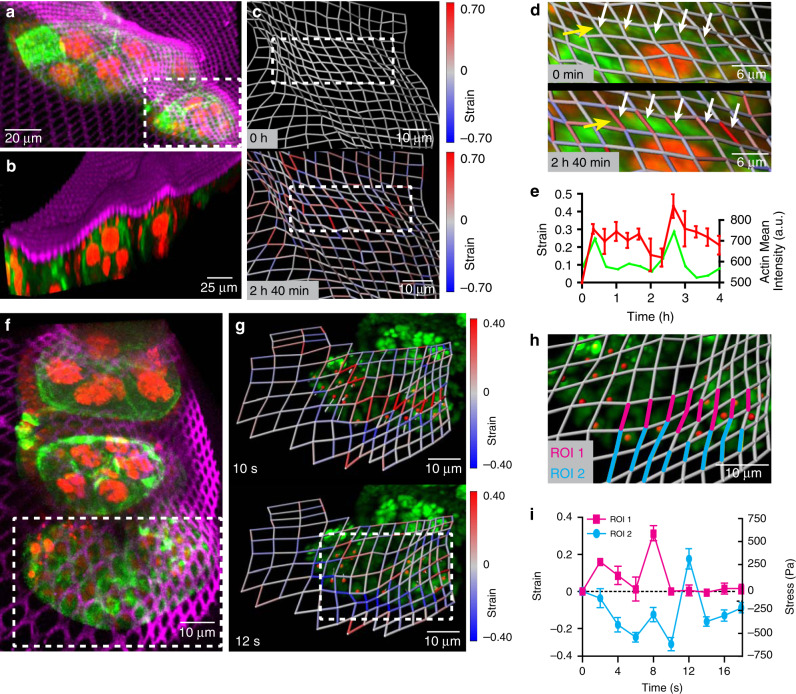
Fig. 5. Utilizing the NMBS for 3D strain mapping on Drosophila ovariole tissue.
a Maximum intensity projection of fluorescence image from live 3D confocal imaging of Alexa-647 fibronectin NMBS (Magenta, 2 µm × 2 µm × 2 µm) applied to a developing Drosophila ovariole expressing moesin-GFP (Green) and Histone-2B-RFP (Red). b 3D render of a diagonal cut plane demonstrating the ability of the NMBS to conform to the 3D surface of the ovariole. c Strain analysis and quantification of region in a (white box) at two time points show regionally localized tensile (red) and compressive (blue) strain over time. d Magnified images (white box in c) of high tensile region (white arrows) corresponding to localized moesin-GFP fluorescence (green, yellow arrows). e Quantification of the average tensile strain (red, white arrows) within the magnified region shows strain peaks correlate with increased moesin-GFP fluorescence (green, yellow arrows) over a 4-h time course (mean S.D.; n = 5 segments over 1 experiment). f Maximum intensity projection of fluorescence image from live high-speed spinning-disk confocal imaging of Alexa-647 fibronectin NMBS (Magenta, 2 µm × 2 µm × 2 µm) applied to a contracting Drosophila ovariole expressing moesin-GFP (green) and Histone-2B-RFP (red). g Time-lapse imaging of region in f (white box) at 0.5 Hz of a 20 µm section of a contracting ovariole with the NMBS (magenta) and histone-2B-RFP (green). Regions of tension (t = 10 s, max of 1.55) and compression (t = 12 s, max of 0.63) are observed during contraction and extension respectively. As the nuclei translate upward during ovariole contraction (t = 10 s; red dots, gray commit tails) there is an increase in tension at their leading edge (max tension = 1.44). As the nuclei move down and the ovariole compresses (t = 12 s), a band of compression along the bottom edge of the ovariole is observed (max compression = 0.60). h Magnified image of strain analysis showing the 3D deformation during ovariole contractions and highlighting regions of compression and tension for quantification. i Quantification of the maximum tensile and compressive regions within the strain map, (ROI 1, magenta; ROI 2, cyan) of the contracting ovariole. Stress during contraction was calculated by using values for the elastic modulus of the germarium and stage 1 ovariole of 2 kPa (mean ± S.D.; ROI 1 n = 10 segments and ROI 2 n = 14 segments over 1 experiment).

