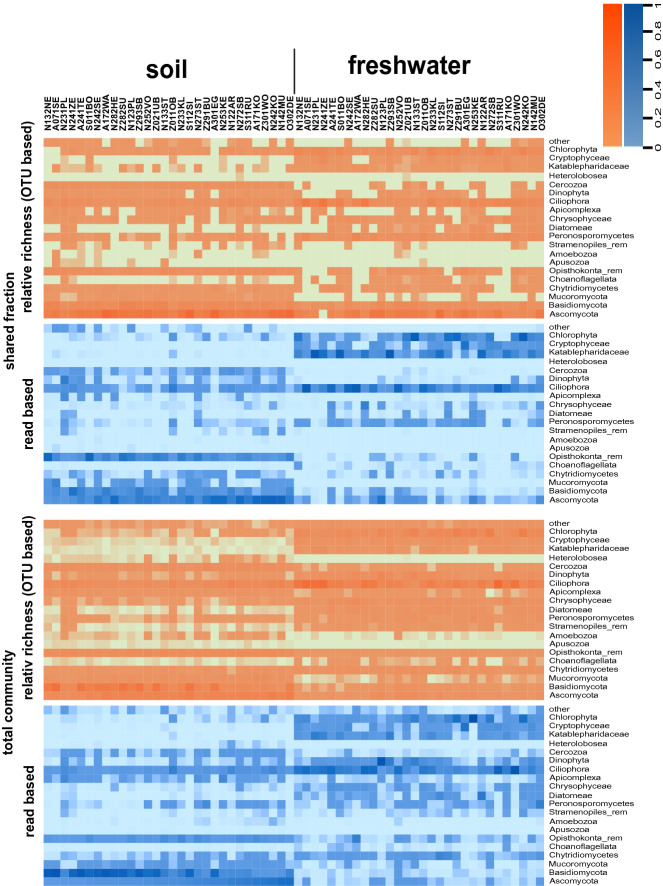
Figure 1.
Relative total community composition (bottom) and relative total composition of the overlapping OTUs (top). Taxonomic composition based on relative abundance of OTUs that are present in at least two sites (blue) and taxonomic composition based on presence absence data of OTUs that are present in at least two sites (orange). The sites are sorted by the abundance of Ascomycota in soil sites. Remaining OTUs which could be assigned to a rough taxonomic level were marked as _rem. Created with the R-package gplots78.

