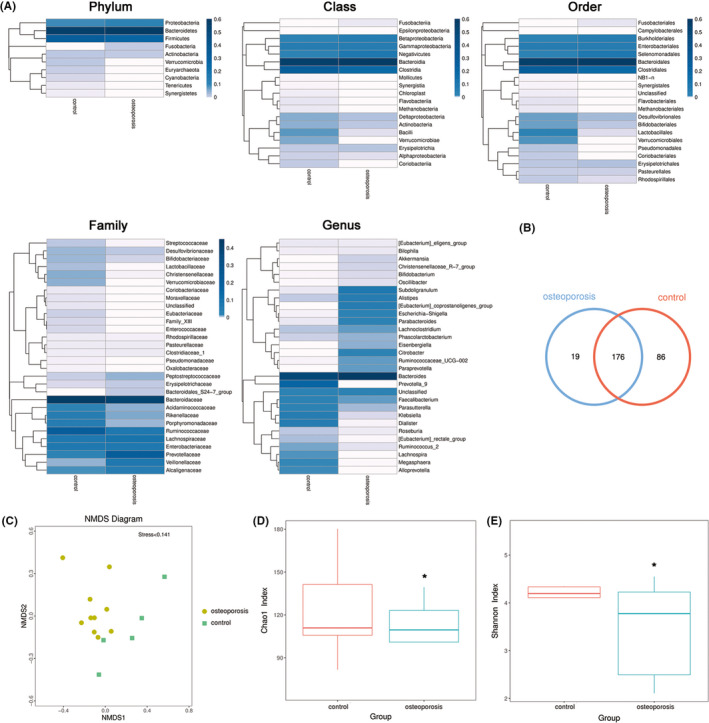
Figure 1.

Characteristics of gut microbiota of healthy controls and osteoporosis patients. A, The heatmap of gut microbiota of healthy controls and osteoporosis patients in different classification. B, Venn diagram shows the changed gut microbiota OTU in healthy controls and osteoporosis patients. C, The NMDS analysis shows the heterogeneity of intestinal microbiota in the healthy controls and osteoporosis patients. D, The Chao1 index and E, Shannon index show the diversity in intestinal microbiota of osteoporosis patients compared with healthy control. *, compared with control group, P < .05
