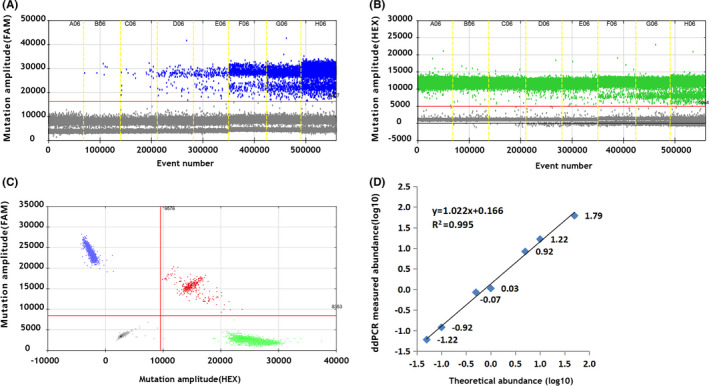
Figure 1.

Representative 1D, 2D, and fractional abundance figures of ddPCR. ddPCR was used to detect the BRAF V600E mutation. FAM, mutant probe; HEX, wild‐type probe. A. & B,. Representative 1D figure showing FAM and HEX fluorescent signals. C,. In the representative 2D figure, the X‐axis represented the wild‐type signals (HEX) while the Y‐axis represented the mutant signals (FAM). D,. Fractional abundances of plasmid dilutions were calculated with QuantaSoft analysis software, and linearity of ddPCR detecting the BRAF V600E mutation was calculated (R 2 = .995, y = 1.022x + 0.166). The X‐axis represents the theoretical abundance of plasmid dilutions of 0.05%, 0.1%, 0.5%, 1.0%, 5.0%, and 10% (log10 transformed value), while the Y‐axis represents the ddPCR‐measured abundance (log10 transformed value)
