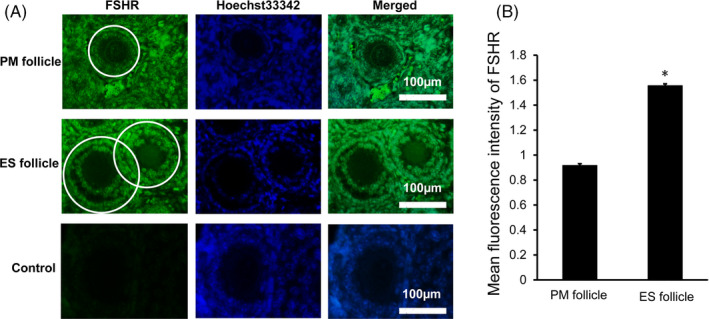
FIGURE 6.

FSHR expression in PM follicles and ES follicles in ovarian tissue of D14 female mice. A, Immunofluorescence staining of FSHR in PM follicles and ES follicles. The FSHR was stained green, and the nuclei were stained blue. The white circle indicates the area used for analyzing relative fluorescence intensity of FSHR expression. The control group was a negative control group. Scale bar: 100 μm. B, Relative fluorescence intensity analysis of FSHR expression. Compared with PM follicles, *P < .05
