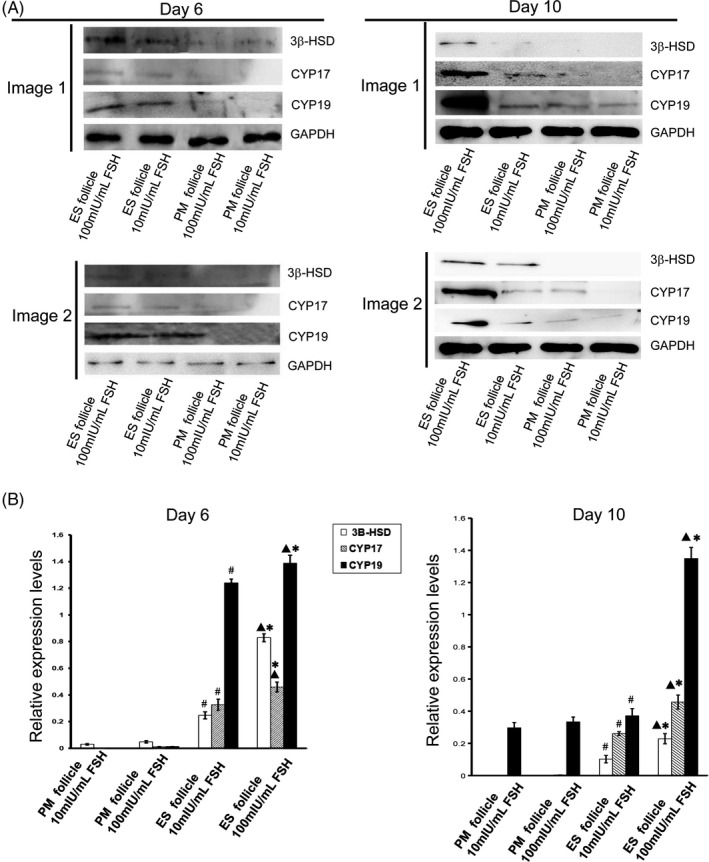
FIGURE 8.

Expression levels of steroid hormone synthesis rate‐limiting enzyme in follicles. A, Western blot analysis of the expressions of 3β‐HSD, CYP 17, and CYP 19 in Day 6 and Day 10 follicles. Image 1 and image 2 were representative Western blot images of two groups of mice. B, Analysis of relative expression levels of 3β‐HSD, CYP 17, and CYP 19 in follicles. ▲P < .05, ES follicle 100 mIU/mL FSH group compared with ES follicle 10 mIU/mL FSH group; #P < .05, ES follicle 10 mIU/mL FSH group compared with PM follicle 10 mIU/mL FSH group; *P < .05, ES follicle 100 mIU/mL FSH group compared with PM follicle 100 mIU/mL FSH group
