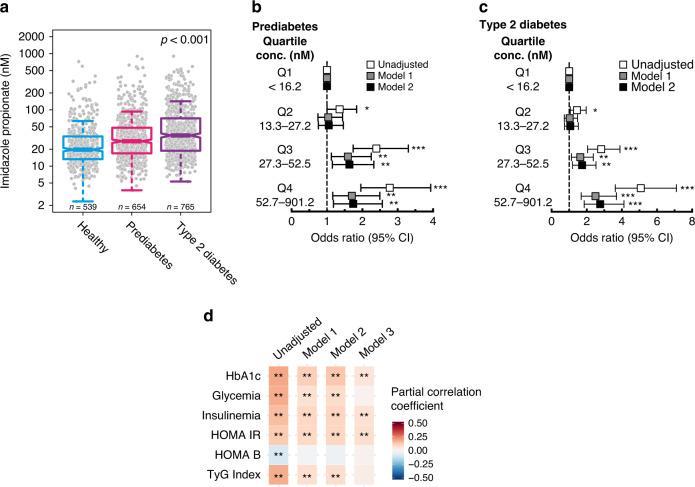
Fig. 1. Imidazole propionate is increased in subjects with type 2 diabetes.
a Serum levels of imidazole propionate in healthy subjects (n = 539), subjects with prediabetes (n = 654), and with type 2 diabetes (n = 765). P-values were calculated with linear regression. Data are represented as boxplots: middle line is the median, the lower and upper hinges are the first and third quartiles, the upper whisker extends from the hinge to the largest value no further than 1.5× the interquartile range (IQR) from the hinge, and the lower whisker extends from the hinge to the smallest value at most 1.5× IQR of the hinge. Gray dots are single data points. b, c. Multinomial logistic regression for prediabetes and type 2 diabetes vs. healthy controls according to imidazole propionate quartiles. Odds ratios (OR) were calculated using the lowest quartile of imidazole propionate (Q1) as reference. Model 1 OR was adjusted for age, gender, body mass index (BMI), and ethnicity. Model 2 OR was adjusted for model 1 plus creatinine clearance. Squares represent OR and the upper and lower whisker the 95% confidence intervals (CI), raw data are presented in Supplementary Table 1. *P < 0.05, **P < 0.01, ***P < 0.001 d. Correlation matrix for imidazole propionate and glycated hemoglobin (HbA1c), glycemia, insulinemia, homeostatic model assessment of insulin resistance (HOMA-IR), updated HOMA model for beta-cell function (HOMA-B), and the triglyceride and glucose (TyG) index. Pearson partial correlation coefficients and P-values were calculated using partial correlations adjusted for Model 1: age, gender, body mass index, and ethnicity. Model 2: Model 1 plus creatinine clearance, Model 3: Model 2 plus diabetes status. False discovery rate (FDR) adjusted *P < 0.05, **P < 0.01. See also Supplementary Table 2. Source data are provided as a Source Data file.

