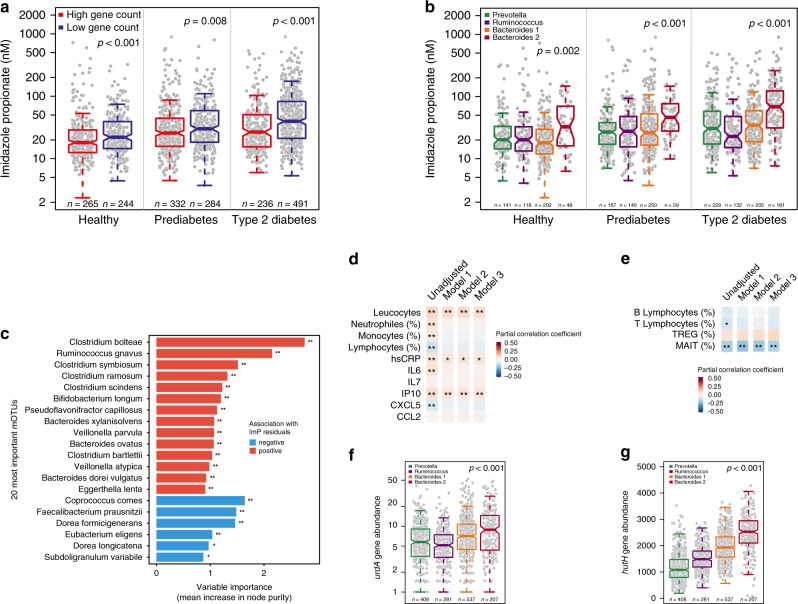
Fig. 2. Imidazole propionate is associated with a pro-inflammatory microbiota.
Serum levels of imidazole propionate (ImP) in healthy subjects (n = 509), subjects with prediabetes (n = 616), and with type 2 diabetes (n = 727) according to a bacterial gene count and b enterotypes. P-values were calculated with linear regression adjusted for age, gender, BMI, ethnicity, and creatinine clearance. c Random forest for the 20 most significant mOTUs correlated with ImP residuals, after adjustment for age, gender, BMI, ethnicity, creatinine clearance, and diabetes status. FDR adjusted P-value of spearman correlation between taxa and imp residuals *P < 0.05, **P < 0.01. See also Supplementary Table 4. d Partial correlation matrix for ImP serum levels and serum leucocytes count (109/l), neutrophils (%), monocytes (%), lymphocytes (%), C-reactive protein (CRP), Interleukin 6 (IL-6), Interleukin 7 (IL-7), Interferon gamma-induced protein 10 (IP-10), C-X-C motif chemokine 5 (CXCL5), chemokine (C-C motif) ligand 2 (CCL2). Pearson partial correlation coefficients and P-values were calculated using partial correlations adjusted for Model 1: age, gender, body mass index, and ethnicity. Model 2: Model 1 plus creatinine clearance, Model 3: Model 2 plus diabetes status. *P < 0.05, **P < 0.01, ***P < 0.001. See also Supplementary Table 5. e Partial correlation matrix in a subgroup of patients (n = 439) between serum ImP and circulating B- and T lymphocytes (%), regulatory T cells (TREG, %) and mucosal-associated invariant T cell (MAIT, %). Partial correlation coefficients (Pearson for all variables except for MAIT cells for which Spearman coefficient was used since variable distribution remained skewed despite log-transformation) and P-values were calculated using partial correlations for Model 1: age, gender, body mass index, and ethnicity. Model 2: Model 1 plus creatinine clearance, Model 3: Model 2 plus diabetes status. *P < 0.05, **False discovery rate (FDR) adjusted P < 0.05. See also Supplementary Table 6. Relative abundances of urdA gene (f) and hutH (g) according to enterotype. P-values were calculated with linear regression adjusted for age, gender, BMI, and ethnicity. For a, b, f, g data are represented as boxplots: middle line is the median, the lower and upper hinges are the first and third quartiles, the upper whisker extends from the hinge to the largest value no further than 1.5× the interquartile range (IQR) from the hinge and the lower whisker extends from the hinge to the smallest value at most 1.5× IQR of the hinge. Gray dots are single data points. Source data are provided as a Source Data file.

