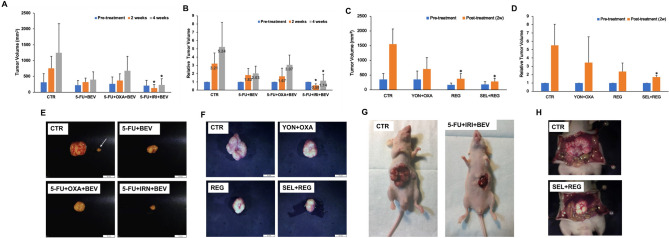
Figure 2.
Drug efficacy testing. For the first study, untreated control (n = 5); 5-FU + BEV (n = 6), 5-FU + OXA + BEV (n = 6); 5-FU + IRI + BEV (n = 5). For the second study, untreated control (n = 6); YON + OXA (n = 4), REG (n = 7); SEL + REG (n = 5). (A) Study 1, comparison of tumor volume before treatment; at 2 weeks; and after treatment. (B) Study 1, comparison of relative tumor volume before treatment; at 2 weeks; and after 4 weeks. (C) Study 2, comparison of tumor volume before treatment and after treatment. (D) Study 2, comparison of relative tumor volume before treatment and after treatment. The data are shown as mean + standard deviation (SD). (E) Study 1, representative images of a harvested tumor in each group. The white arrow shows the intrahepatic metastasis along with the primary implanted tumor. Scale bar: 10 mm. (F) Study 2, representative images of harvested tumor in each group. (G): Study 1, representative images of the control and treated tumors. (H) Study 2, representative images of the control and treated tumors.

