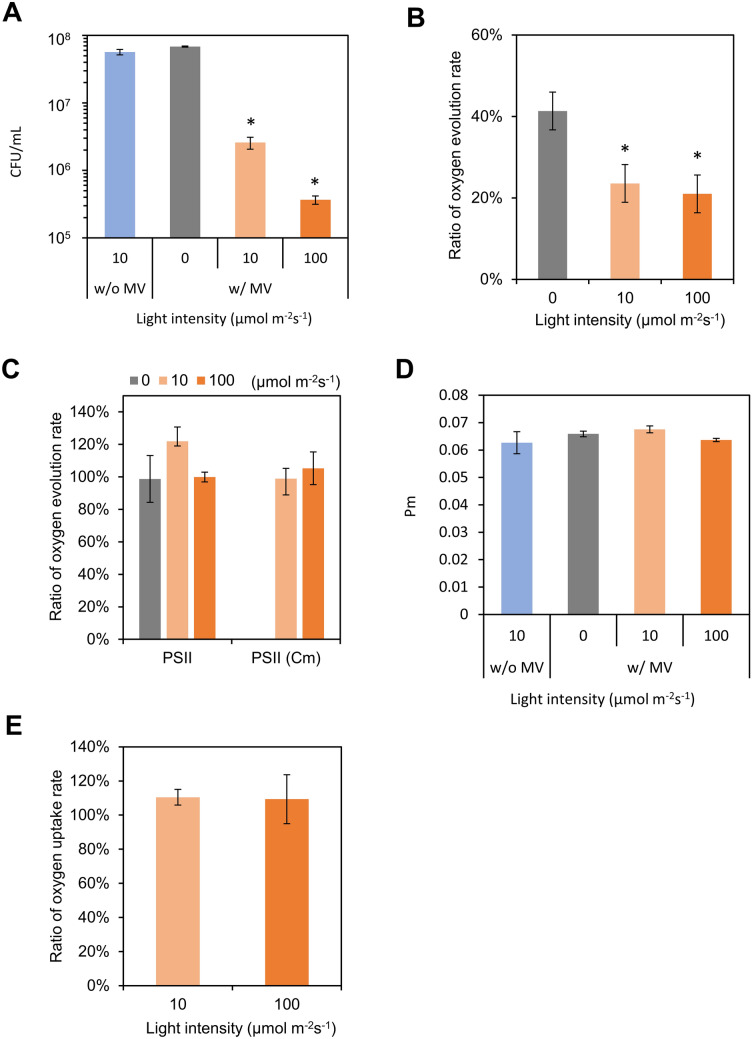
Figure 3.
Evaluation of oxidative stress generated by MV/light treatment. (A) MV/light-treated cells were spotted on agar plates and grown to visualize the effects of MV/light treatment on cell viability. Obtained colonies were counted to calculate CFU. Values and error bars represent means ± SD of three technical replicates. Significant differences from CFU without MV were evaluated by student’s t tests (*P < 0.01). (B,C) The ratio of the oxygen evolution rate of 10 µg Chl/mL suspension-containing cells treated with and without 50 µM MV under three light intensities (MV/light treatment) was measured in the presence of (B) NaHCO3, (C) DCBQ, or DCBQ and 200 µg/mL chloramphenicol, indicated as PSII and PSII (Cm), respectively. (D) Oxidizable P700 (Pm). (E) Ratio of oxygen uptake rate of 10 µg Chl/mL suspension containing cells, treated with or without 50 µM MV to examine MV/light treatment-induced oxidative damage of the photosynthetic electron transport chain, including components from PSII to PSI. For measurement of oxygen uptake, 1 mM MV, 1 mM KCN and 10 mM methyl amine were added to a 10 µg Chl/mL suspension containing MV/light-treated cells in an oxygen electrode chamber. (B–E) Values and error bars represent means ± SD of three independent experiments. Significant differences from the samples treated in dark (0 µmol m−2 s−1) with MV were evaluated by student’s t tests (*P < 0.05).

