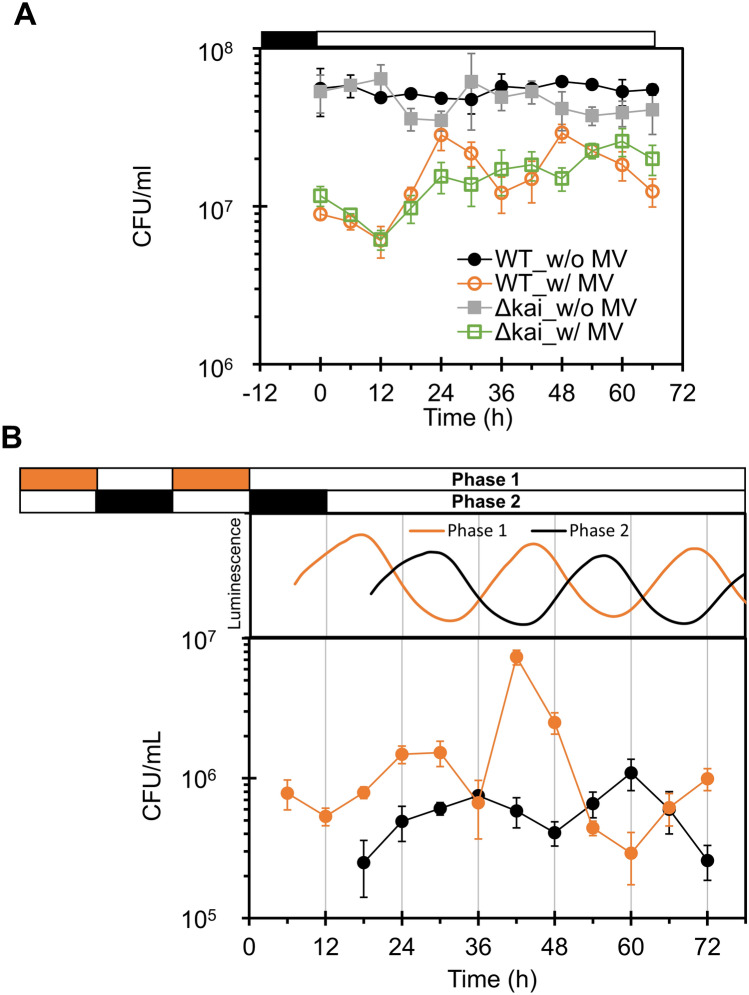
Figure 4.
Time series of CFU of MV/light treated cells. (A) Wild type (WT) and kaiABC-deficient mutant (ΔkaiABC) cells were harvested from turbidostat every 6 h, followed by MV/light treatment (10 µmol m−2 s−1) of each aliquot. Oxidative stress tolerance was visualized as the number of colonies. (B) ROS tolerance of WT cell cultures entrained in antiphase were tested every 6 h. Luminescence rhythms of WT cells were also measured to identify the phase of each culture, and are shown above the CFU graph. White and black or orange bars denote light–dark (LD) cycles. Values and error bars represent means ± SD of three technical replicates.

