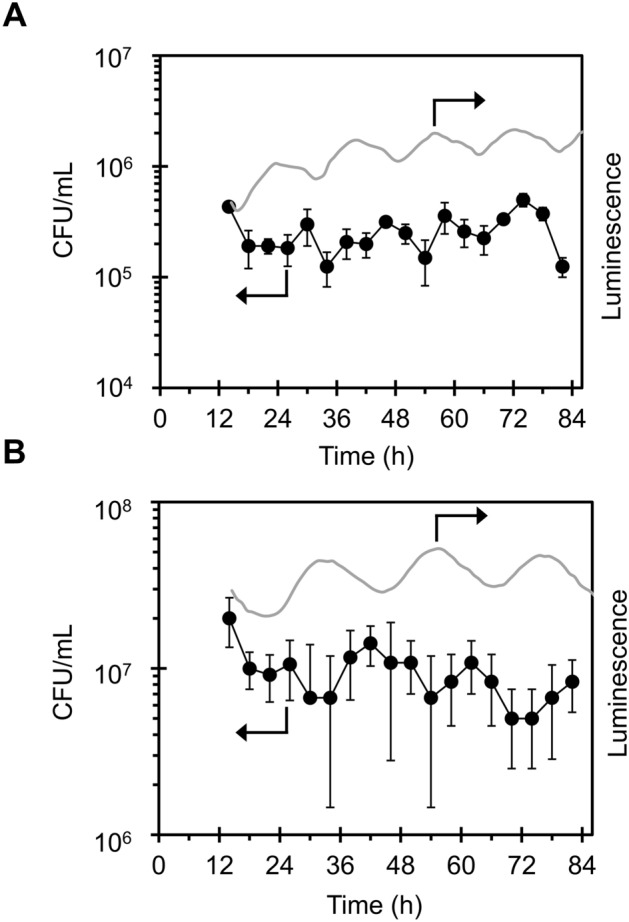
Figure 5.

Correlation of period length between gene expression rhythms and ROS tolerance rhythms of period mutant strains. ROS tolerance of (A) F470Y and (B) S157P strains cultured in continuous light conditions following 12 h light/12 h dark cycles for entrainment were tested. Gray lines indicate luminescence traces of the cells, which confirm the expected short-period phenotype. Values represent means of three technical replicates.
