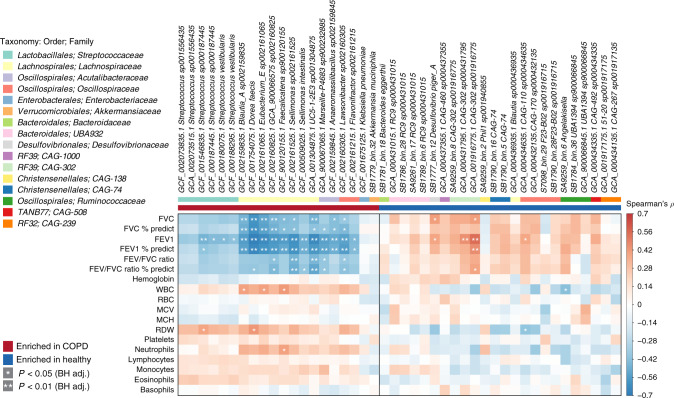
Fig. 3. Correlation of members of the faecal microbiome with lung function.
Spearman’s rho calculated between mapping-based read counts per genome and phenotypic scores. Genomes included are those from Supplementary Data 11, with enrichment in either COPD or healthy samples indicated by the coloured bar along the top of the heatmap. White stars within heatmap boxes indicate significant results (*p < 0.05; **p < 0.01, Student’s t test (two-sided), Benjamini–Hochberg adjustment for multiple comparisons. Exact p values are provided in Supplementary Data 34). Genome abundances were centred with log-ratio transformation prior to analysis. FVC forced vital capacity, FEV forced expiratory volume, WBC white blood cell, RBC red blood cell, MCV mean corpuscular volume, MCH mean corpuscular haemoglobin, RDW red cell distribution width. COPD: n = 28; healthy: n = 29.

