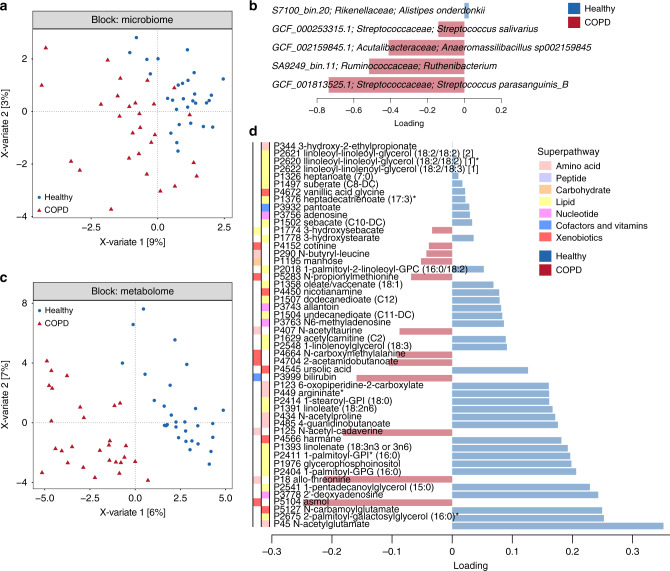
Fig. 4. Faecal metabolome of COPD patients (n = 28) is distinguished from that of healthy individuals (n = 29) using a multi-omic analysis.
a DIABLO sample plot demonstrating discrimination between COPD and healthy samples based on microbiome data. b Genomes contributing to separation along with component 1 of (a). Bar length indicates loading coefficient weight of selected genomes, ranked by importance, bottom to top; bar colour indicates the group in which the sequence variant has the highest median abundance, red = COPD, blue = healthy. Microbiome data are centred log-ratio-transformed relative abundance, filtered for genomes with minimum 0.05% relative abundance in at least ten samples. c DIABLO sample plot demonstrating discrimination between groups based on metabolomics data. d Metabolites contributing to separation along with component 1 of (c). Metabolome data are log-transformed median-scaled values with missing values imputed using the minimum value for each compound, filtered for metabolites returning measurements in at least ten samples.

