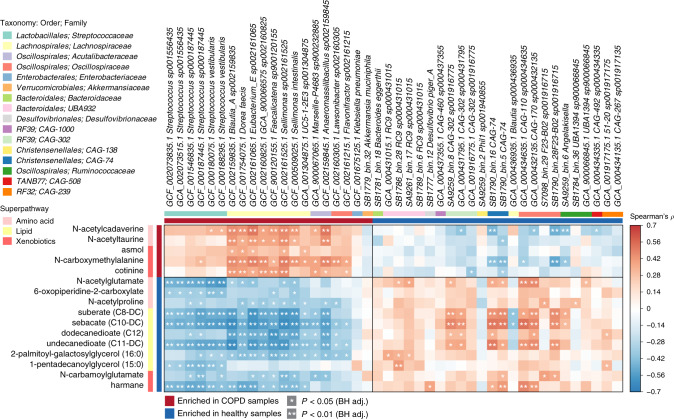
Fig. 5. COPD-associated species correlate with metabolites differentiating COPD (n = 28) and healthy (n = 29) individuals.
Species and metabolites included are those identified as significantly differential between COPD and healthy samples, including age, sex and BMI within the relevant models (Supplementary Data 7 and 21). Enrichment in either group indicated by coloured bars to the left and top of the plot. Significant correlations denoted by white stars (*p < 0.05; **p < 0.01, Student’s t test (two-sided), Benjamini–Hochberg adjustment for multiple comparisons. Exact p values are provided in Supplementary Data 35). Higher taxonomy of species (order, family) and super pathway of metabolites are indicated by coloured bars.

