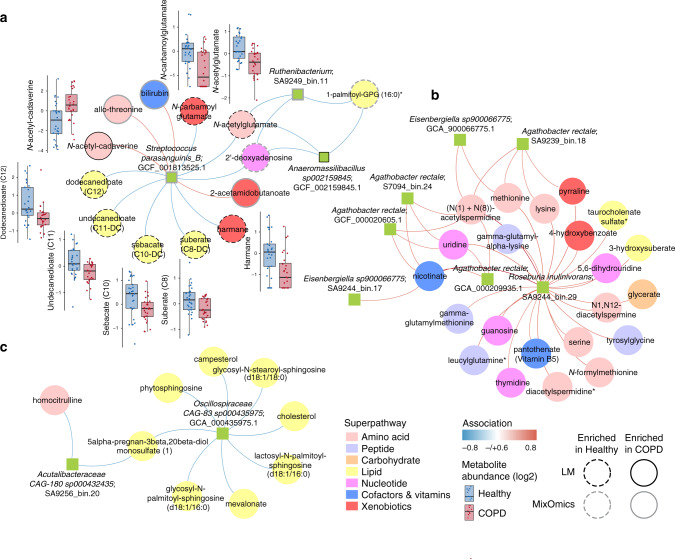
Fig. 6. Integration of faecal microbiomes and metabolomes identifies a COPD-associated network.
a–c Integration of microbiome and metabolome datasets using the software DIABLO produced association networks showing correlations between bacterial species and metabolites. A positive correlation between nodes is indicated by red connecting lines, negative correlation by blue. Species and metabolites enriched in COPD or healthy samples are denoted by solid or dashed borders, respectively. Black borders indicate significance in the linear model adjusted for age, sex and BMI (p < 0.05, Wald test (two-sided) with Benjamini–Hochberg adjustment for multiple comparisons, Supplementary Data 7 and 21) and grey borders indicate selection by MixOmics as discriminatory along with component 1 of Fig. 4a, b. All metabolites significant within the linear model were also selected by MixOmics. The abundance of metabolites (log-transformed median scaled) significant in the linear model provided as boxplots adjacent to the relevant nodes. Each box centres on the median, with lower and upper bounds representing the first and third quartile (25th and 75th percentile), respectively. Whiskers extend 1.5 times the interquartile range from the outer bounds. Microbiome data filtered for genomes with minimum of 0.05% relative abundance in ≥10 samples. Metabolome data filtered for metabolites returning measurements in ≥10 samples. Microbiome data are centred log-ratio- transformed relative abundance. Metabolomics data are log-transformed median-scaled values with missing values imputed using a minimum value for each compound. COPD: n = 28; healthy: n = 29.

