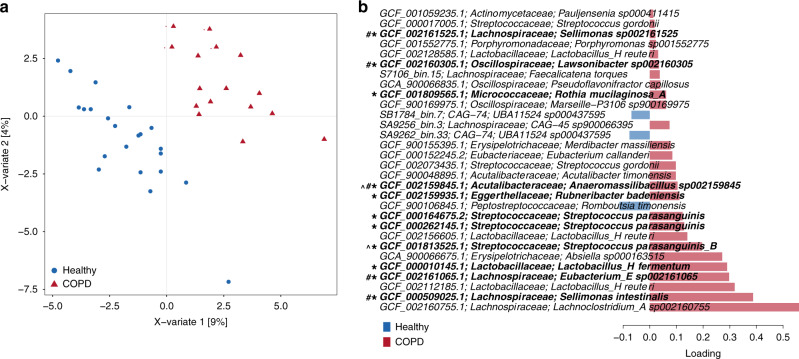
Fig. 7. Association of gut microbiome members with COPD replicate in an independent cohort.
a Multivariate sparse partial least-squares discriminant analysis (sPLS-DA) of read-mapping-based relative abundance at the genome level of the faecal microbiome, filtered for genomes with minimum 0.05% relative abundance in at least one sample. b Genomes contributing to separation along with component 1 of sPLS-DA from (a). Bar length indicates loading coefficient weight of selected genomes, ranked by importance, bottom to top; bar colour indicates the group in which the genome has the highest median abundance, red = COPD, blue = healthy. Genomes marked with * are those within the discriminatory signature defined for the study cohort (Fig. 2), # indicates genomes associated with clinical phenotypes (Fig. 3) and ^ indicates genomes within the disease-associated network (Fig. 6). COPD: n = 16; healthy: n = 22.

