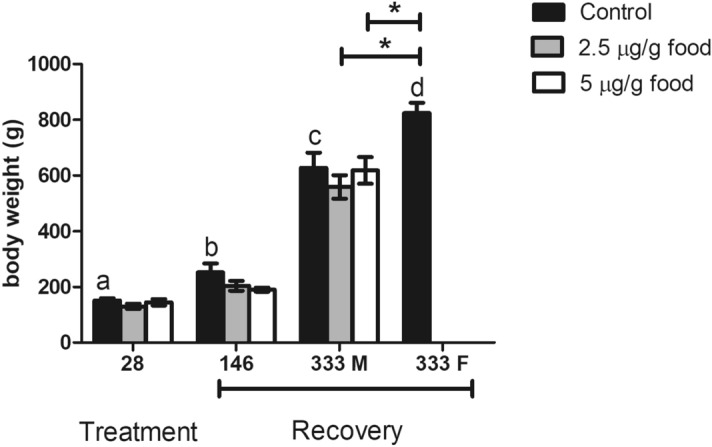
Figure 1.

Effects of EE2 dietary intake on fish body weight after 28 days of treatment with 0 (control), 2.5 and 5 µg/g food, and after 28 days of treatment with 0 (control), 2.5 and 5 µg/g food followed by 146 and 333 days of feeding a standard diet (recovery). Data represent the means ± S.E.M. of duplicate samples. M, male specimens; F, female specimens. *Denote statistically significant differences between treated and control groups and letters indicate differences in the control group at distinct sampling times, as determined by one-way ANOVA and LSD post hoc tests.
