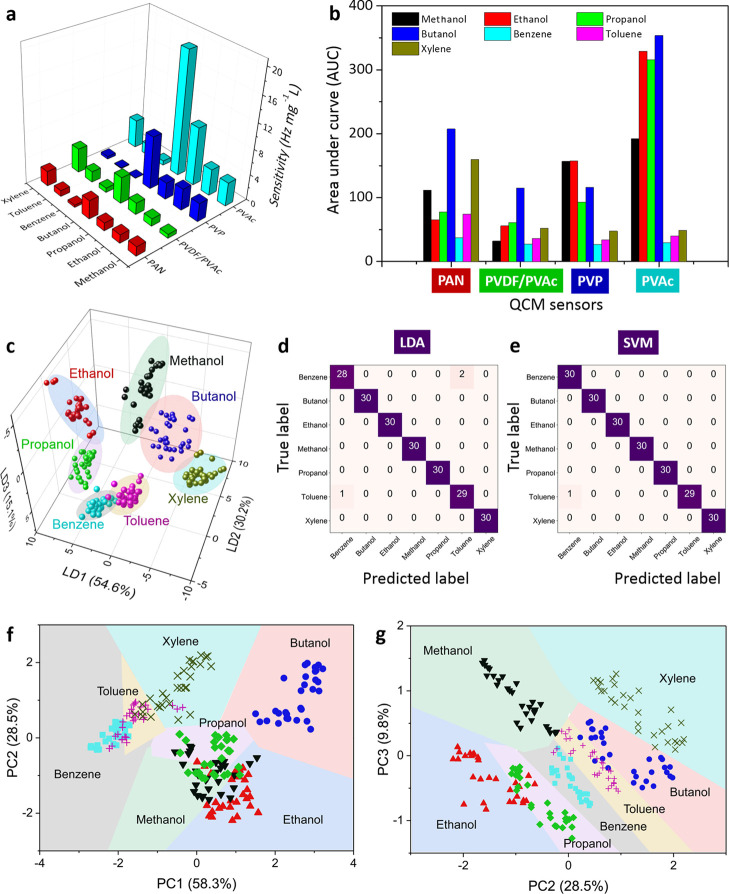
Figure 3.
(a) Sensitivities of four QCM sensors coated with different polymers (i.e., PAN, PVDF/PVAc, PVP, and PVAc) exposed to various VOCs. (b) Area under the curve (AUC) profiles of sensing responses obtained with the QCM-based e-nose system. (c) Classification of seven different VOCs by the e-nose system using a linear discriminant analysis (LDA) model. Confusion matrix of the QCM-based e-nose performance using (d) LDA and (e) support vector machine (SVM) algorithms. The SVM-based decision region plots for (f) PC1 versus PC2 and (g) PC2 against PC3.

