Figure 1.

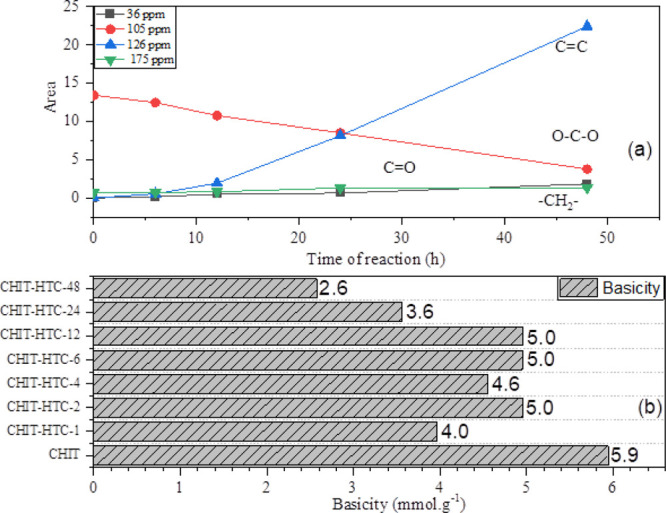
Variation of the signal areas of the 13C CP-MAS-NMR spectra corresponding to O–C–O, CH2, C=O, and C=C groups (a) and basicity of the parent chitosan and HTC samples, as measured with a diluted HCl solution (b).

Variation of the signal areas of the 13C CP-MAS-NMR spectra corresponding to O–C–O, CH2, C=O, and C=C groups (a) and basicity of the parent chitosan and HTC samples, as measured with a diluted HCl solution (b).