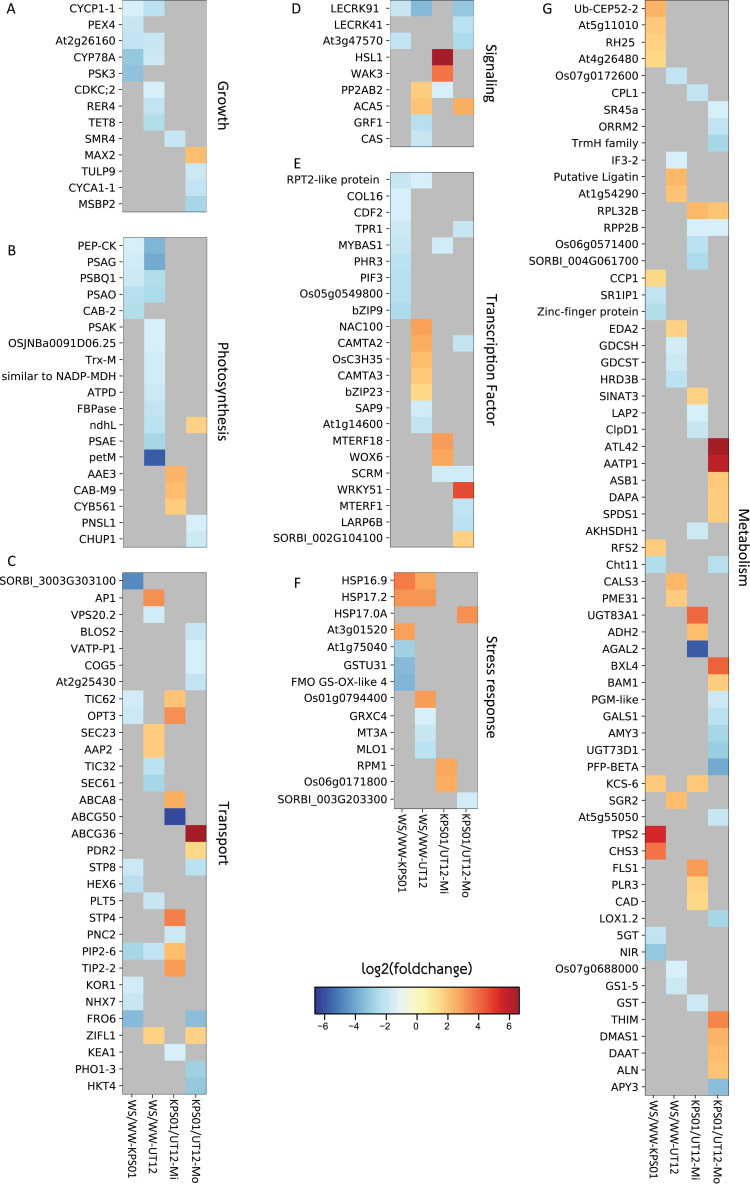
Figure 1. Differentially expressed genes in sugarcanes under the water-stressed treatments.
The heat maps show log2 of the fold change of non-redundant DEGs that are classified into seven classes of (A) growth, (B) photosynthesis, (C) molecular transport, (D) signaling, (E) transcription factor, (F) stress response, and (G) metabolism-related genes. Heat map columns that are labeled as WS/WW-KPS01 (lane 1) and WS/WW-UT12 (lane 2) show log2 of the fold change of DEGs obtained from WS/WW comparisons for KPS01-12 and UT12, respectively. Heat map columns that are labeled as KPS01/UT12-Mi (lane 3) and KPS01/UT12-Mo (lane 4) show log2 of the fold change of DEGs obtained from KPS01-12/UT12 comparisons at mild WS and moderate WS, respectively. Colors scaled from blue to red show log2 of fold change levels from up-regulation to down-regulation. Cells with dark grey color show insignificant expression changes of a gene at a specific condition. The full name of each DEG is shown in Table S4.

