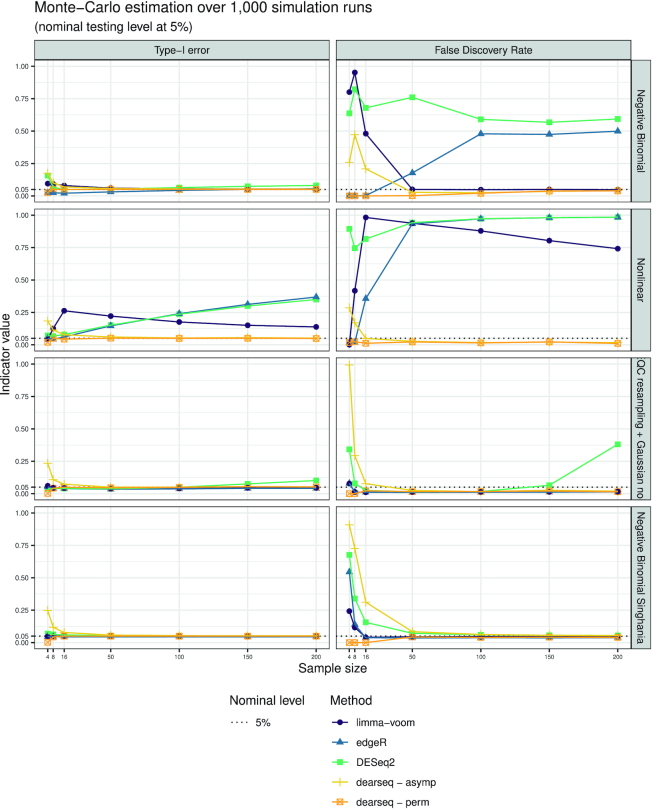
Figure 1.
Type I error and FDR curves for each DEA method with increasing sample sizes. In each setting (negative binomial, nonlinear, SEQC data resampling and data-driven negative binomial), the type I error is computed as the number of significant genes among the true negative, and the FDR as the average number of false positives among the genes declared DE.

