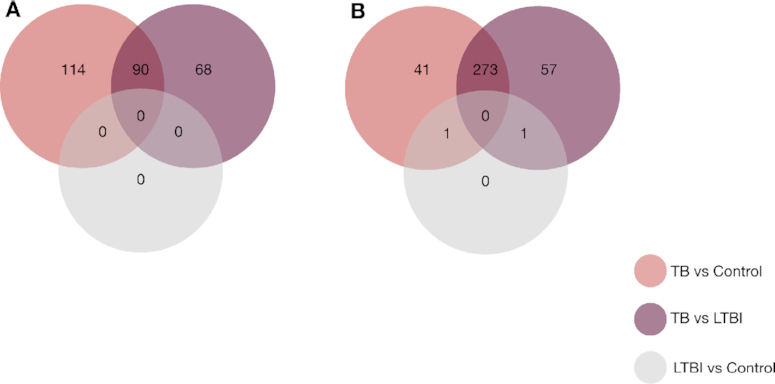
Figure 3.

Venn diagram showing overlap of DE genes using dearseq and the original edgeR signature among the three comparisons performed. (A) Venn diagram showing the results of the three DEA using dearseq. Note that no DE gene was found with our method comparing the LTBI group and the control group, unlike edgeR that found two such genes to be DE. (B) Venn diagram showing the results of the DEA using edgeR (Singhania et al.).
