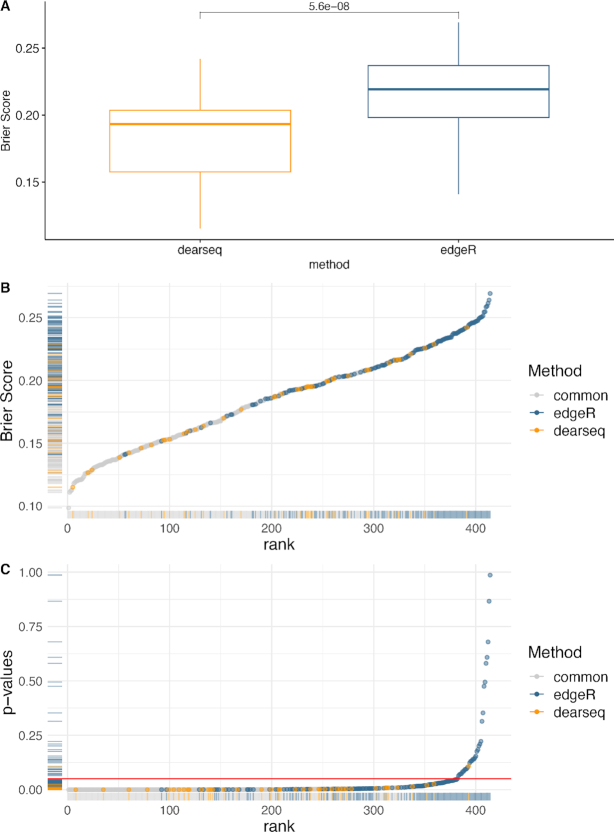
Figure 4.
Comparing edgeR-based signature to the signature derived by dearseq. (A) Boxplots of the Brier scores of the 41 genes private to dearseq (i.e. not also declared DE by edger) and the 142 genes private to the original edgeR analysis. (B) Univariate Brier scores. The blue points correspond to genes found only in the original edgeR signature, the yellow points correspond to genes found only in the dearseq signature and the gray points correspond to genes found in both signatures. (C) Marginal P-values from a univariate logistic regression combined with a leave-one-out cross-validation for the 40 dearseq-private and the 142 edgeR-private genes. The red line indicates the common 5% P-value threshold.

