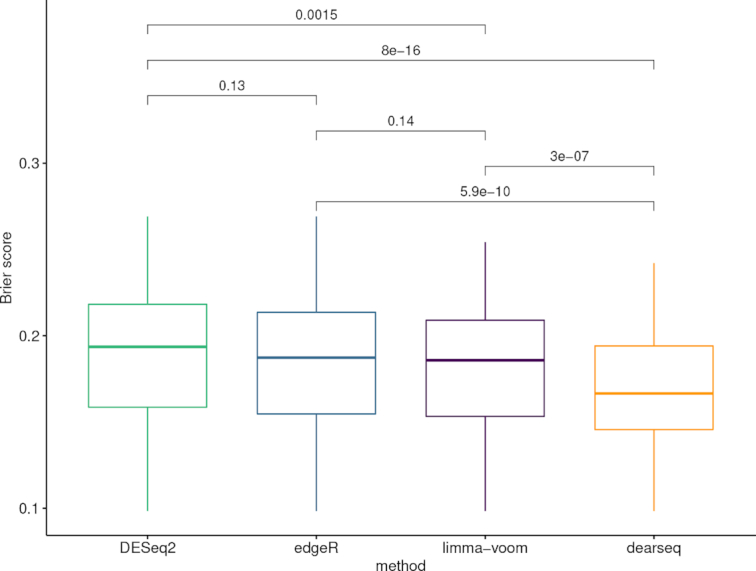
Figure 6.

Boxplots of the Brier scores of all the genes declared DE by the four methods. Boxplots of the Brier scores of all the DE genes called by dearseq, DESeq2, limma-voom and edgeR (Singhania et al.). The predictions are derived from a logistic regression combined with a leave-one-out cross-validation. Smaller Brier scores are better.
