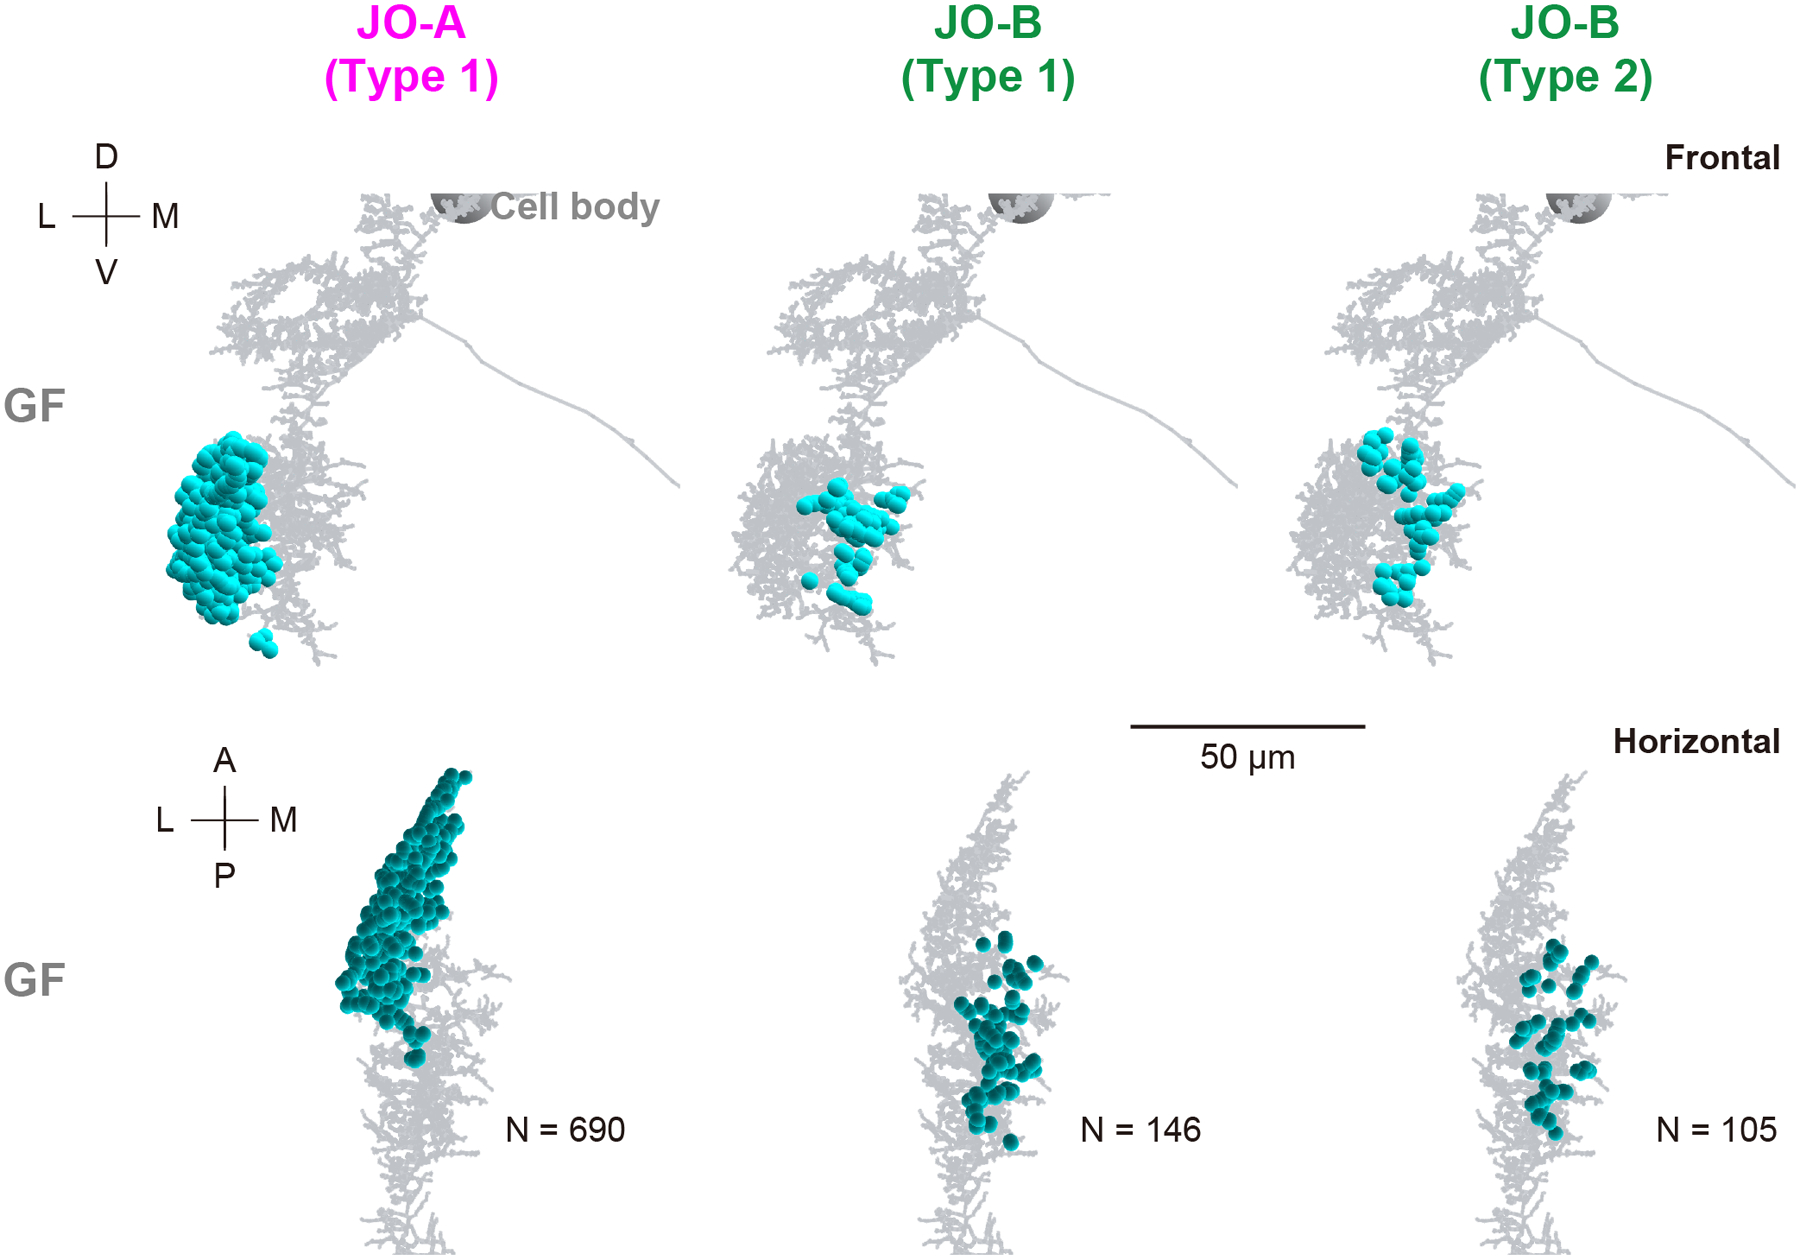
Figure 13 |. Distribution of synapses from JO neurons to the GF neuron.

Frontal (top) and horizontal views (bottom) of synapse distributions (light blue dots) from type-1 JO-A (left), and type- 1 (middle) and 2 (right) JO-B neurons to the dendritic regions of GF neuron (gray) are shown. N at the bottom panel indicates the number of synapses. A, anterior; D, dorsal; L, lateral; M, medial; P, posterior; V, ventral.
