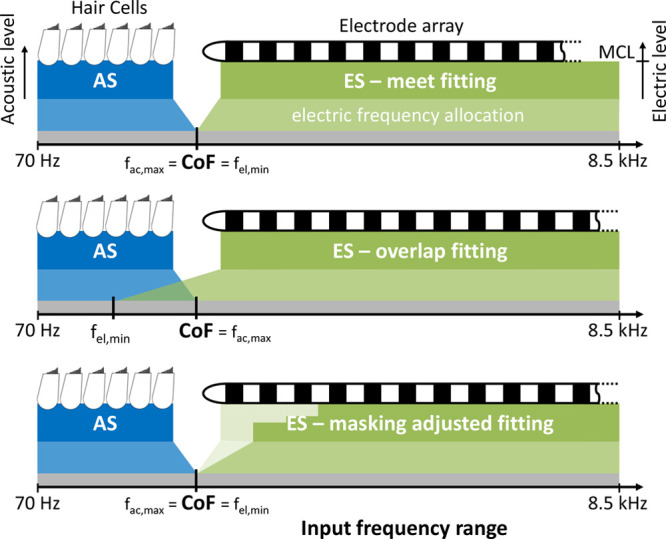
Fig. 3.

Schematic overview over the three fitting strategies used in the study: meet fitting that divides the ES and AS at the CoF (top), overlap fitting with extended electric frequency range (middle), and UNMASKfit map with reduced electric stimulation levels (bottom). AS indicates acoustic stimulation; CoF, crossover frequency; ES, electric stimulation; MCL, most comfortable level; UNMASKfit, masking adjusted fitting.
