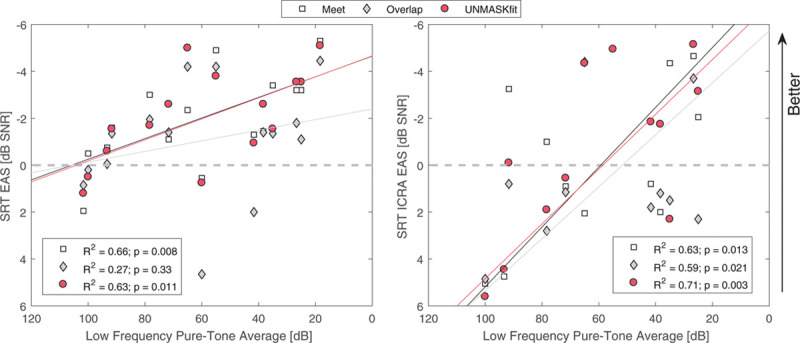
Fig. 7.

Speech reception thresholds, tested for conditions EAS, ES, AS, and temporally modulated noise with EAS (ICRA EAS) for grouped subjects with different fitting strategies meet (white), overlap (gray), and UNMASKfit (red). Subjects are grouped according to their fitting, that is, individualized (left) or mean UNMASKfit map (right). Box plots show the group statistics and the circles denote mean values. The text inset N − x for acoustic listening mode indicates the number of subjects that could not be tested. AS indicates acoustic only; EAS, electric-acoustic stimulation; ES, electric only stimulation; ICRA EAS, ICRA-5 fluctuating noise with male speaker temporal modulations; UNMASKfit, masking adjusted fitting.
