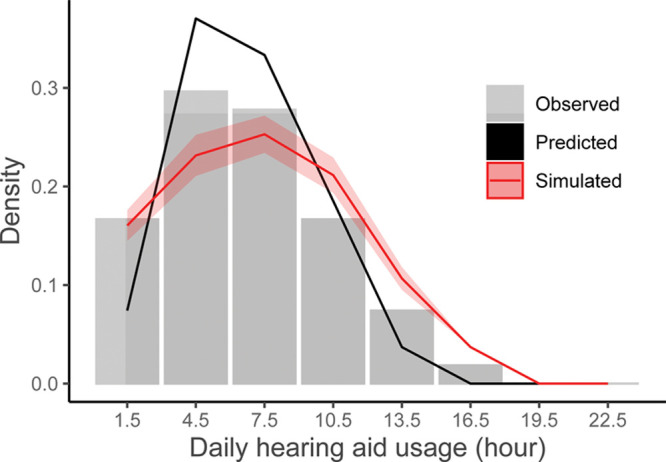
Fig. 1.

Density histogram of observed daily hearing aid usage (gray bars) together with the model prediction (solid black line) and a simulation of usage times (solid red line with confidence intervals) given changes to the sound environment. The x axis represents daily hearing aid usage intervals (bin-centers). The width of each bin is 3 hr. The y axis represents the density, that is, how likely the different usage intervals are to occur. For the observed data, the density for a specific usage time is equal to the proportion of observed usage times within that interval, divided by the total number of usage times. The prediction is based on a linear mixed model of the observed hearing aid usage per hour predicted by acoustic parameters sampled by the hearing aids (see model coefficients in Table 1). The simulation was produced by increasing the observed levels by 20 dB SPL and decreasing the sound clarity by decreasing the signal to noise ratio by 5 dB SPL to mimic a scenario that worsens the sound environment for hearing aid users.
