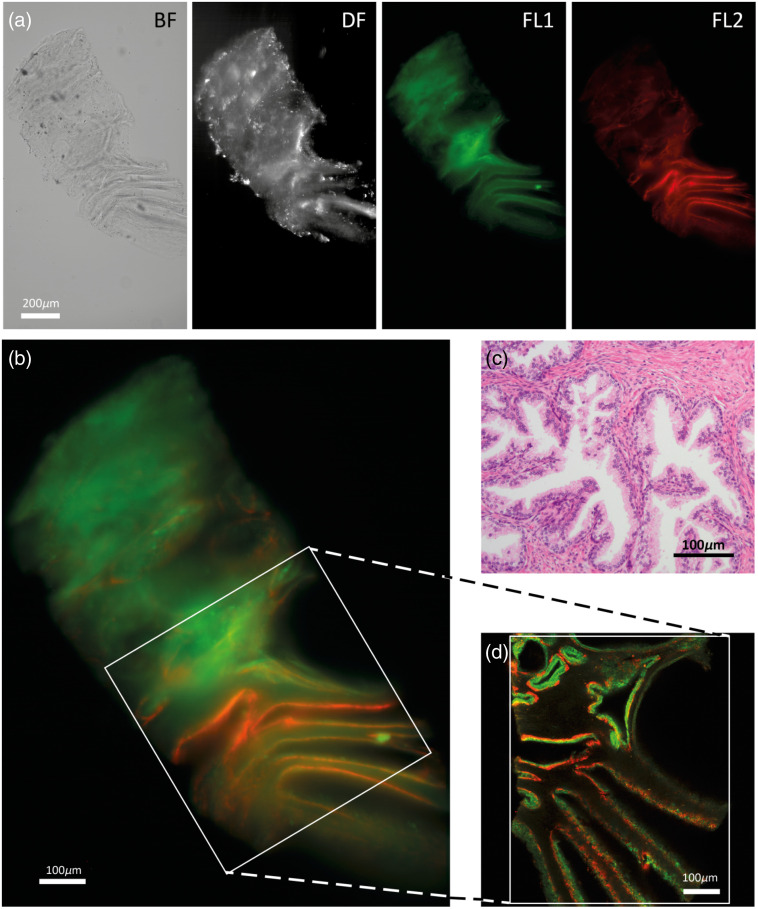
Fig. 3.
(a) and (b) BF, DF and Alexa488 and Alexa647 Fluorescence (FL1 and FL2, respectively) typical images of the z-stack obtained with the oCelloscope. The scale bar depicted in the right panel represents . (c) H&E-stained tissue section, and (d) cross section of the confocal microscope showing the same structures with CK8-18 positive luminal epithelial cells (green) and CK5 positive basal epithelial cells (red) in benign transition zone prostate glands.

