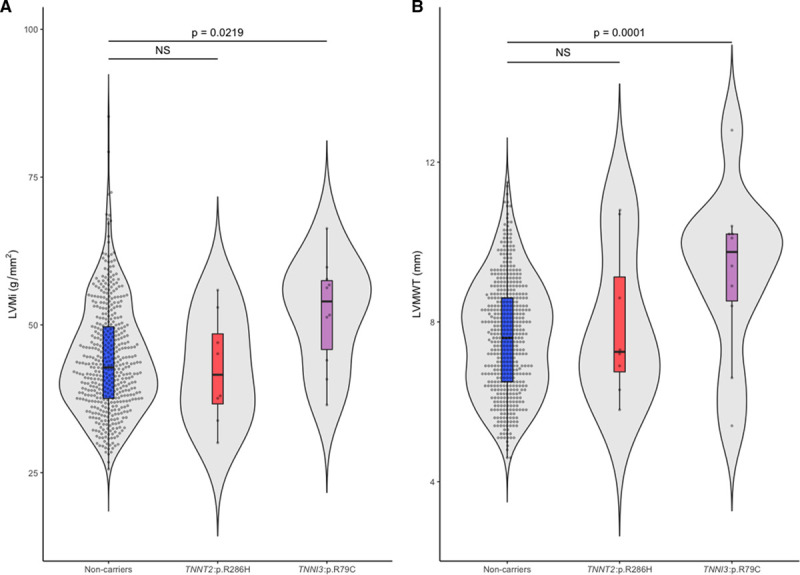
Figure 3.

TNNI3:p.R79C and TNNT2:p.R286H: Cardiac indices in the general population. Violin plots comparing (A) indexed left ventricular (LV) mass (LVMi) and (B) left ventricular maximum wall thickness (LVMWT) in population controls with or without TNNI3:p.R79C or TNNT2:p.R286H, derived using cardiac magnetic resonance (CMR). Data were represented as median ± interquartile range (IQR) in a violin box-and-whiskers plot (Tukey rule) with the whiskers representing 1.5× IQR and outliers were plotted as individual dots. P values of regression models were derived using ANOVA where a significance cutoff of P<0.05 was used.
