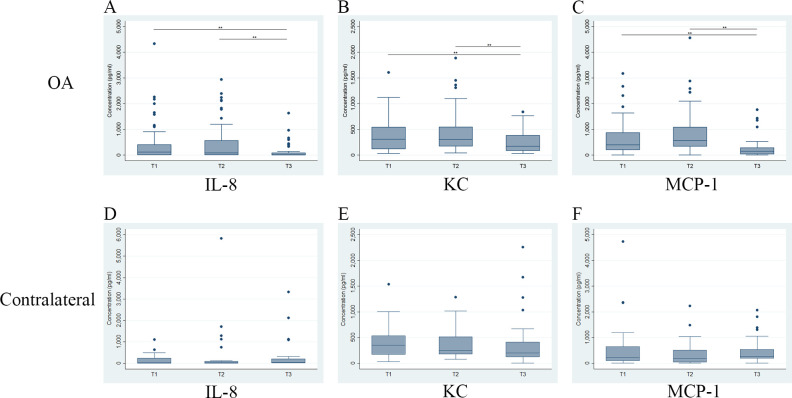
Fig 3. Comparison of temporal changes of concentrations of synovial fluid IL-8, KC and MCP-1 biomarkers for the OA group dogs.
The first row of graphs are for synovial fluid samples from index stifles (OA) and the second row are for synovial fluid samples from the stable stifles of dogs in the OA group (contralateral). The time points evaluated are initial visit (T1), 4-week recheck (T2) and 12-week recheck (T3). The horizontal line inside each box is the median and the upper and lower edges of box present the inter-quartile range (IQR). The whiskers are either 1.5 × IQR or the range, whichever is smaller. Dots outside the fence are outliers. * if P < 0.05; ** if P < 0.01.

