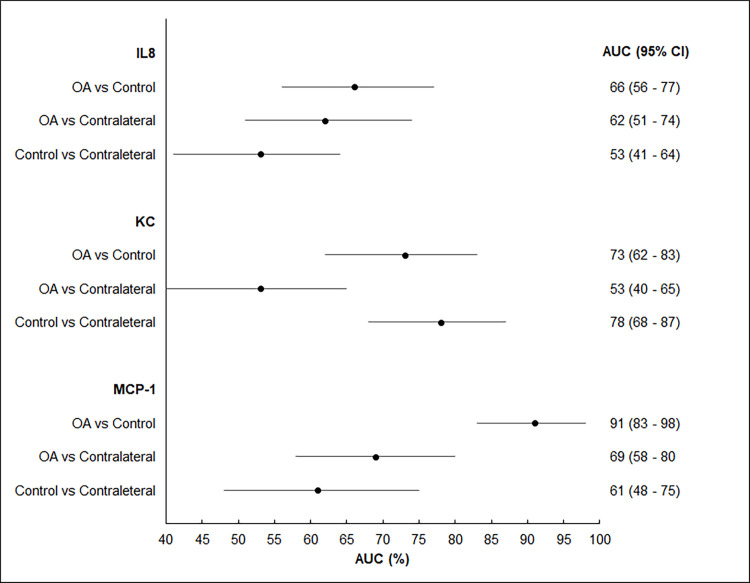
Fig 4. Discriminative performance of synovial fluid IL-8, KC and MCP-1 biomarkers’ ROC model performance at T1 time point for the OA group compared to control.
The forest plot depicts the area under the curve (AUC) and 95% confidence interval (CI) to quantify the overall discriminative performance. Comparisons are between synovial fluid samples from the index (OA) and contralateral stifles from the OA group and control synovial fluid samples. An AUC = 1 indicates a perfect discriminative ability, whereas an AUC = 0.5 indicates no discriminative ability. It desired to have an AUC ≥ 0.9 for a clinically acceptable performance.

