Fig 7. Dry mass comparisons.

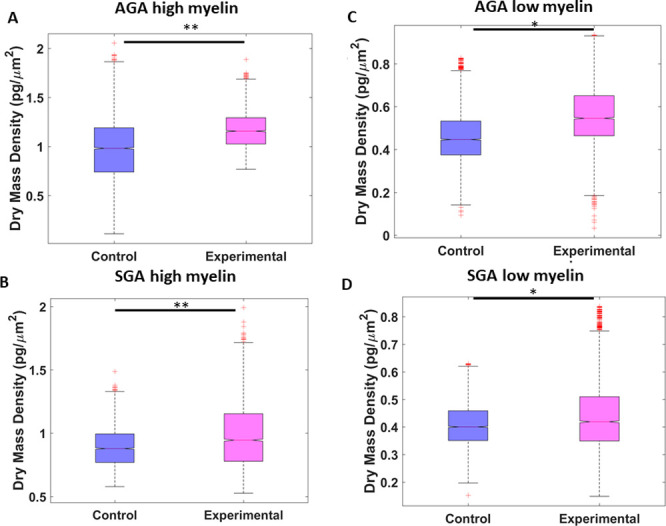
(A) Difference in dry mass density per quarter frame of total AGA tissue with high myelin, (B) SGA with high myelin, (C) AGA with low myelin, (D) and SGA with low myelin. (* p<0.05, ** p<0.01).

(A) Difference in dry mass density per quarter frame of total AGA tissue with high myelin, (B) SGA with high myelin, (C) AGA with low myelin, (D) and SGA with low myelin. (* p<0.05, ** p<0.01).