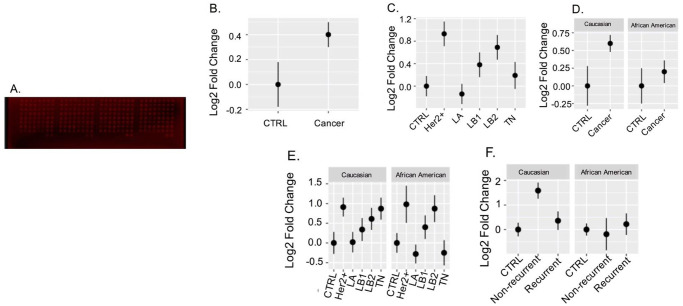
Fig 2. Serum concentration levels of vitronectin in patient samples from RPPA.
A. Image displays the RPPA dot blot which was stained with the vitronectin antibody. Intensity values were taken from here and then analyzed. B-F. Displays comparisons of mean relative values of each group using standard error for error bars. B. analyzes overall serum vitronectin levels in control group (n = 40) and cancer group (n = 200). C. analyzes serum vitronectin levels (overall) in control groups and compared with the other tumor subtypes. Her2+ and LB2 show significant differences when compared to control group. D. compares control and cancer groups by ethnicity, and we find that CA cancer shows a significantly higher vitronectin concentration levels. E. we see that it compares vitronectin levels of AA and WA patients by dividing into various tumor characteristics. However, we found that there are significant differences in Her2+ and LB2 subtypes in the AA group when compared to AA controls. F. compares recurrent versus non-recurrent patient samples by ethnic groups. We found that there is a significant difference in serum vitronectin levels in non-recurrent CA compared to the control and recurrent groups, while AA samples had similar levels of serum vitronectin in all three groups.

